This is the readme for the model for
Lytton WW; Omurtag A. Tonic-clonic transitions in computer
simulation. J Clinical Neurophys, 24:175-181, 2007.
PMID: 17414973
Usage Notes:
To recreate Fig. 4: (will likely only run under unix); after
installing a version at least as recent as NEURON -- Release 6.1.1
(1894) 2007-11-24 (version displayed when you start nrngui) type the
following:
nrnivmodl
nrngui batch_.hoc
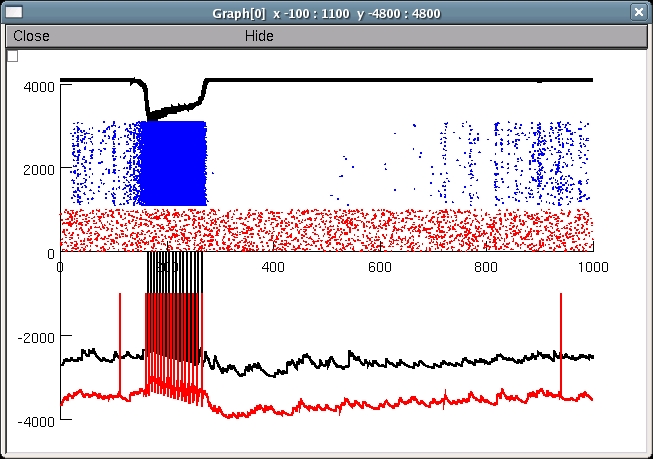
In under 2 minutes (on 2.8GHz Pentium 4) a display shows Expressor
Field at top (black) Expressor (blue) and Driver (red) rasters 2
Expressor voltage traces at bottom y-axis is arbitrary except for
rasters:
 This version recreates the connectivity matrix with different seeds
and is therefore not identical to the original (I was not being
careful with seeds at the time since I was storing the connectivity)
in addition to the graph, a panel is launched that allows you to look
at several other voltage traces that were recorded during the run
Changelog
---------
2022-05: Updated MOD files to contain valid C++ and be compatible
with the upcoming versions 8.2 and 9.0 of NEURON.
This version recreates the connectivity matrix with different seeds
and is therefore not identical to the original (I was not being
careful with seeds at the time since I was storing the connectivity)
in addition to the graph, a panel is launched that allows you to look
at several other voltage traces that were recorded during the run
Changelog
---------
2022-05: Updated MOD files to contain valid C++ and be compatible
with the upcoming versions 8.2 and 9.0 of NEURON.