This is the readme file for the model associated with the paper:
Bar-Yehuda D, Korngreen A (2008) Space clamp problems when voltage
clamping neurons expressing voltage-gated conductances. J Neurophysiol
You can auto-launch from ModelDB (after you have installed NEURON) and
then choose Potassium or Calcium conductance simulations to generate
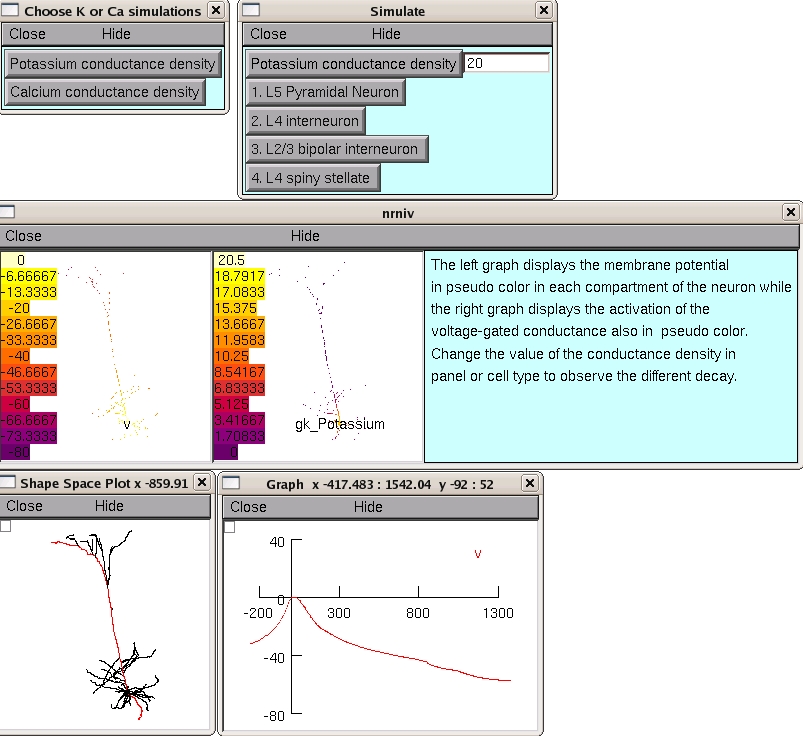
figures associated with Figures 1 and 4. You can further create graphs
of sample spatial voltage values by selecting from the NEURON Main
Menu "Graph" -> "Shape Plot" and then drag the mouse from the box in
the upper left corner of the graph to select "Space plot" from the
pop-up menu. Finally, drag the mouse from the lower extremity of the
cell to the top. When you release the mouse button a graph of the
voltage along the path you selected through the cell appears (see
bottom of below figure which was created after Potassium and then the
L5 Pyramidal Neuron were selected and then after the run (takes about
20 seconds) the above shape plot procedure was followed):
 Alternatively you can run the files manually. The demo code contains
two simulations. The "potassium.hoc" file contains code simulating
parts of figure 1. The "calcium.hoc" file contains code simulating
parts of figure 4. To run the simulations you will have to first
compile the MOD files in the SpaceClampDemo directory (nrnivmodl under
Linux, mknrndll under windows, or drag and drop the SpaceClampDemo
folder onto the mknrndll icon under MAC OS X). To run the simulations
simply run one of the above HOC files, or the mosinit.hoc file. In
windows just double click on the icon, in Linux invoke the "nrngui
filename -" command, and under the MAC drag and drop the mosinit.hoc
file onto the nrngui icon.
All simulations will generate two graphs, one displaying the membrane
potential in pseudo color in each compartment of the neuron and one
displaying the activation of the voltage-gated conductance also in
pseudo color.
Alternatively you can run the files manually. The demo code contains
two simulations. The "potassium.hoc" file contains code simulating
parts of figure 1. The "calcium.hoc" file contains code simulating
parts of figure 4. To run the simulations you will have to first
compile the MOD files in the SpaceClampDemo directory (nrnivmodl under
Linux, mknrndll under windows, or drag and drop the SpaceClampDemo
folder onto the mknrndll icon under MAC OS X). To run the simulations
simply run one of the above HOC files, or the mosinit.hoc file. In
windows just double click on the icon, in Linux invoke the "nrngui
filename -" command, and under the MAC drag and drop the mosinit.hoc
file onto the nrngui icon.
All simulations will generate two graphs, one displaying the membrane
potential in pseudo color in each compartment of the neuron and one
displaying the activation of the voltage-gated conductance also in
pseudo color.