A Model of Tight Junction Function In CNS Myelinated Axons
The two models included can be implemented in NEURON v5.9 or v6.2:
1) a myelinated axon is represented by an equivalent circuit with a
double cable design but includes a tight junction in parallel with the
myelin membrane RC circuit (called double cable model, DCM).
2) a myelinated axon is represented by an equivalent circuit with a
double cable design but includes a tight junction in series with the
myelin RC circuit (called tight junction model, TJM).
These models have been used to simulate data from compound action
potentials measured in mouse optic nerve from Claudin 11-null mice:
Devaux, J.J. & Gow, A. (2008) Tight Junctions Potentiate The
Insulative Properties Of Small CNS Myelinated Axons. J Cell Biol 183,
909-921.
ModelDB accession number: 122442
A detailed description of the models has been submitted to Neuron Glia
Biology.
Both models were designed using CellBuilder andChannelBuilder and are
set up to simulate a small axon of 0.6um diameter with 3 wraps of
membrane in each of 20 myelin sheaths. Each .ses file includes the
active properties of the model: Nav, Kf, Ks channels and leak.
Ion concentrations (specified in Distributed Mechanisms -> Managers ->
Homogenous spec) are:
Na out = 160 mM
Na in = 30 mM
K out = 5 mM
K in = 140 mM
Specifying axons of different sizes
An excel spreadsheet is included to enable calculation of the passive
properties for DCM and TJM axons of different diameters. Active
properties remain constant. Default values of the parameters that were
used for publication are included in the spreadsheet
1) specify the axon diameter, Di (bright yellow), optional parameters
(pale yellow), tight junction and myelin resistivities (olive). Reduce
tight junction resistivity by 10-fold to simulate an axon lacking
tight junctions
2) insert the calculated values (pink) into NEURON in the Geometry
page of CellBuilder
3) insert the calculated values (bright blue) into NEURON in the
Biophysics page (extracellular parameters)
4) insert event times from the PointProcessManagers in NEURON into the
spreadsheet (gray) to calculate CV
Contact for assistance:
agow@med.wayne.edu
Reproducing fig. 6d or 6e requires running each model a couple of
times using different extracellular resistances. these resistances are
calculated using the spreadsheet.
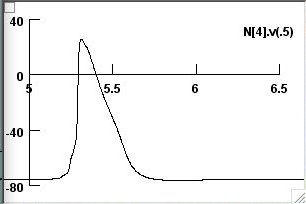
As a starting point, I have attached 3 screenshots (in the screenshots
folder) for the TJM to generate the solid (screenshot 1)
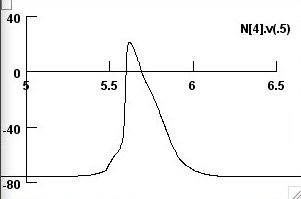
 the dashed (screenshot 2)
 and both APs (screenshot 3)
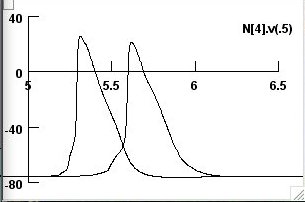 in fig 6d. we can then modify this as necessary (see the screenshots
folder in the archive for parameter settings).
in fig 6d. we can then modify this as necessary (see the screenshots
folder in the archive for parameter settings).