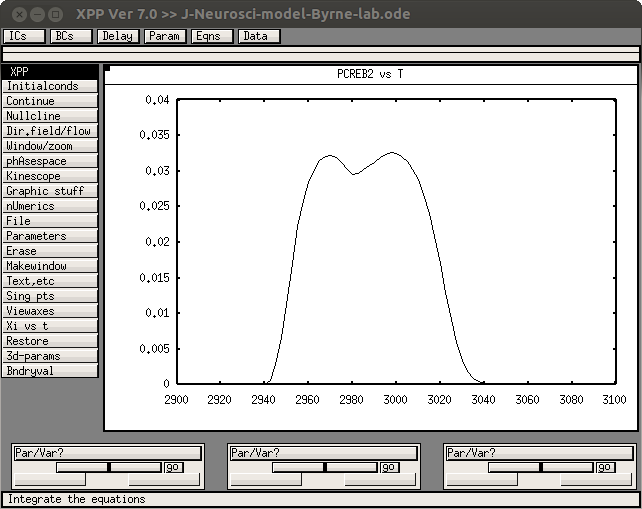
This is the readme for the model associated with the paper:

Liu RY, Zhang Y, Baxter DA, Smolen P, Cleary LJ, Byrne JH (2013)
Deficit in Long-Term Synaptic Plasticity Is Rescued by a
Computationally Predicted Stimulus Protocol J. Neurosci. 33:6944-6949

This is the code the authors used and was contributed by Dr Yili
Zhang.  It requires xpp by Bard Ermentrout, available for download for
many platforms from http://www.math.pitt.edu/~bard/xpp/xpp.html

Example use:

Example use:

Start with XPPAUT with a command like (unix/linux platform)

xpp LiuEtAl2013.ode -silent

Because XPP code is run in silent mode, a data file will be created in
the current folder. After simulation, all the data points of variables
in ODE will be automatically output into this data file. Besides the
variables in ODE, any parameters or expressions, e.g. pCREB1*CREB2,
can be output into the data file by command "aux" e.g.,
aux 1=pCREB1*CREB2

The default name of data file is output.dat, or it can be changed to
any other name by command "@ output=NameofDatafile".

"output.dat" can be opened in MicrosoftExcel or any other software for
data analysis or graph plotting.

---

Example interactive run:

Start with XPPAUT with a command like (unix/linux platform)

xppaut LiuEtAl2013.ode

Change the output variable to PCREB2 and
(click on Graphic stuff -> (E)dit curve
press enter and then change the y value to PCREB2)
and then start:
Initalconds -> (G)o

If you resize the graph to 2900 to 3100 in the x axis and 0 to 0.04 in
the y-axis:

Window/zoom -> (W)indow

(and then enter the values in the table and press OK) you should have
a graph resembling the red trace in Fig. 3D in the paper: