Readme file for:
Cohen, MX (2014). Fluctuations in oscillation frequency control spike
timing and coordinate neural networks. Journal of Neuroscience.
These files were contributed by Mike X Cohen.
Matlab files (*.m) are for Figure 2. They are cross-platform and do
not require any toolboxes. The neuron equations are based on
Izhikevich 2003. Additional comments can be found in the .m files.
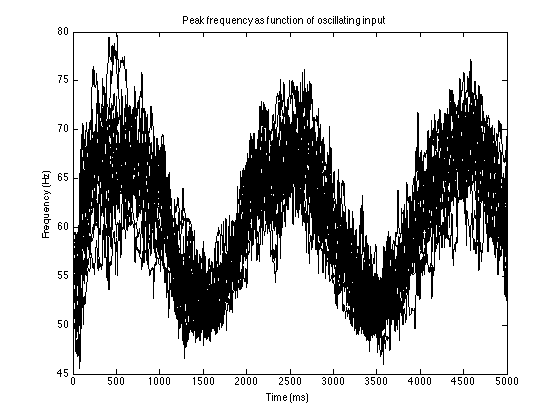
The code for Fig. 2c is izh_freqslide_timevaryinginput.m and
generates:
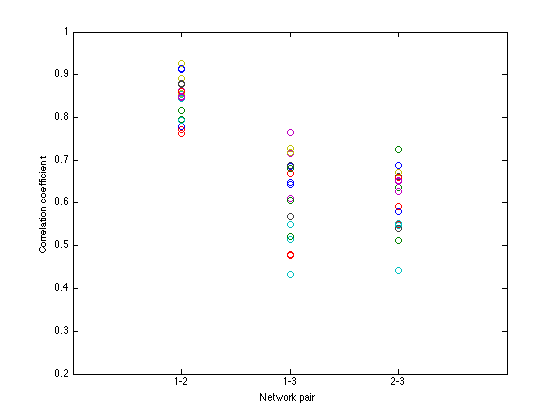
 Running the Fig. 2e code, izh_freqslide_timevaryinginput3networks.m,
generates a figure like
Running the Fig. 2e code, izh_freqslide_timevaryinginput3networks.m,
generates a figure like
 Python files (*.py) are for Figure 3. The scripts require the Brian
toolbox (Goodman and Brette, 2008) in Python 2.7. (Running the scripts
in a different version of Python or Brian may require some
re-programming.) The script will produce a .mat file that can be
imported into Matlab. Additional comments can be found in the files
adex_*.py.
An example run of the network in a linux shell prompt:
$ python adex_network2column_sineinput.py 20140602_1650.mat
then analyzed at the matlab command prompt:
>> load 20140602_1650.mat
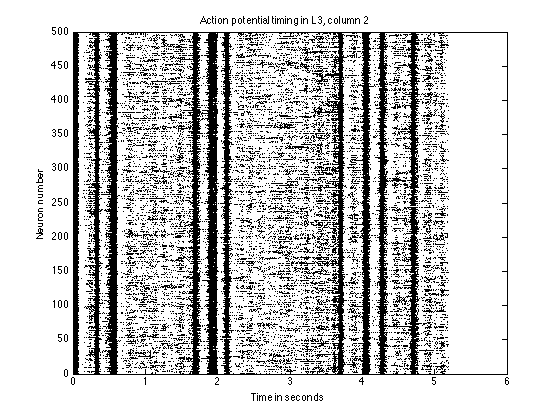
>> adex_static_basic_analysis
makes graphs of the network activity:
Python files (*.py) are for Figure 3. The scripts require the Brian
toolbox (Goodman and Brette, 2008) in Python 2.7. (Running the scripts
in a different version of Python or Brian may require some
re-programming.) The script will produce a .mat file that can be
imported into Matlab. Additional comments can be found in the files
adex_*.py.
An example run of the network in a linux shell prompt:
$ python adex_network2column_sineinput.py 20140602_1650.mat
then analyzed at the matlab command prompt:
>> load 20140602_1650.mat
>> adex_static_basic_analysis
makes graphs of the network activity:
 and power spectrum that includes the region in Figure 3A:
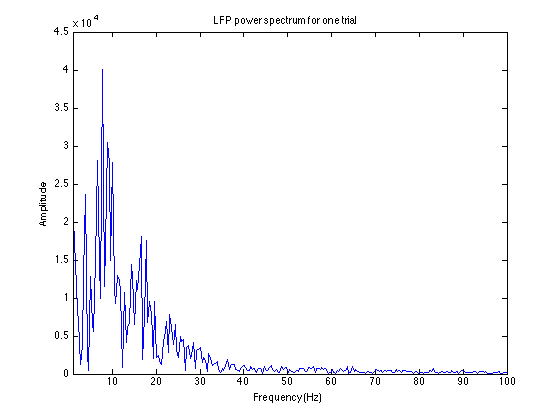 however as the matlab figure is just one example its a lot more noisy
because figure 3A contains the results averaged over 100 runs.
however as the matlab figure is just one example its a lot more noisy
because figure 3A contains the results averaged over 100 runs.