This is the readme for the models associated with the paper:
Ueyama Y (2017) Optimal feedback control to describe multiple
representations of primary motor cortex neurons.
J Comput Neurosci 43:93-106
DOI: 10.1007/s10827-017-0650-z
Y Ueyama supplied the matlab code. It requires mpt to be
installed.
As mentioned in the paper
"The downloaded files are composed of one data set, ‘data.mat,’ and
three codes: ‘DesignMPC.m,’ ‘RunSimulation.m,’ and
‘PlotSensoryGain.m.’ DesginMPC.m designs the model predictive
controller for the isometric torque production task, and replicates
the dataset data.mat. RunSimulator.m loads data.mat, executes the
simulation, and produces some of the figures found in Figs. 3-4 and
9. PlotSensoryGain.m also carries out the simulation and plots the
figures found in Figs. 5 and 6."
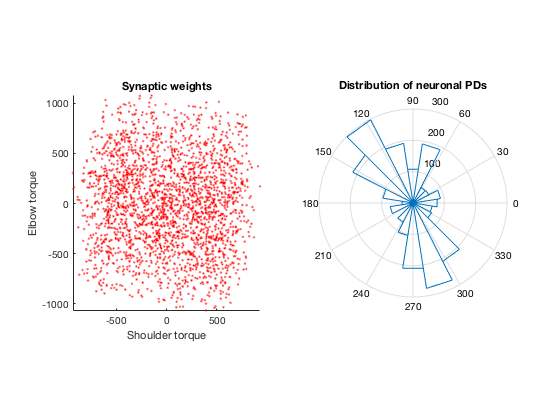
If you have mpt installed (see above link) typing RunSimulation on
the matlab command line will generate the following figures similar to
the paper's figure 3a:
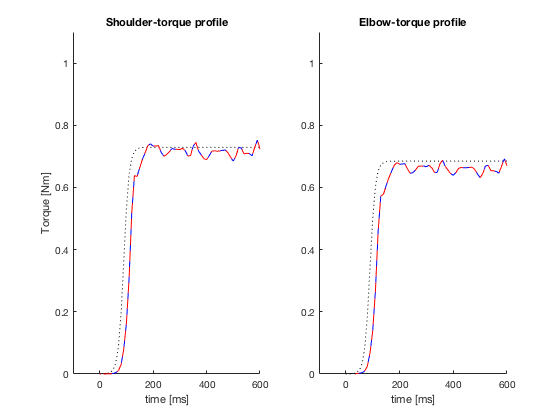 figure 2b:
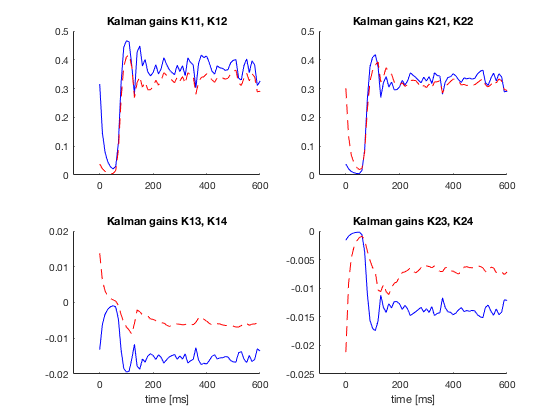 figure 4a:
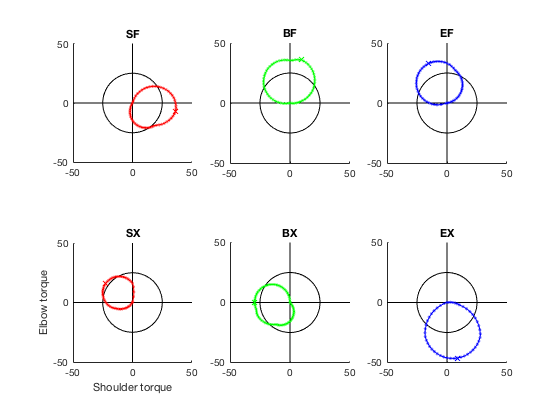 figure 9b top, 9c top: