The matlab model for the paper:
Yuan Y, Pang N, Chen Y, Wang Y, Li X (2017) A Phase-Locking Analysis
of Neuronal Firing Rhythms with Transcranial Magneto-Acoustical
Stimulation Based on the Hodgkin-Huxley Neuron Model
Frontiers in Computational Neuroscience
https://doi.org/10.3389/fncom.2017.00001
is available as a zip file in the supplementary material at the
journal web site:
http://journal.frontiersin.org/article/10.3389/fncom.2017.00001/full#supplementary-material
(a file named "Data Sheet 1.zip" contains the matlab code and you
should be prompted to save it on your computer when you follow the
above link).
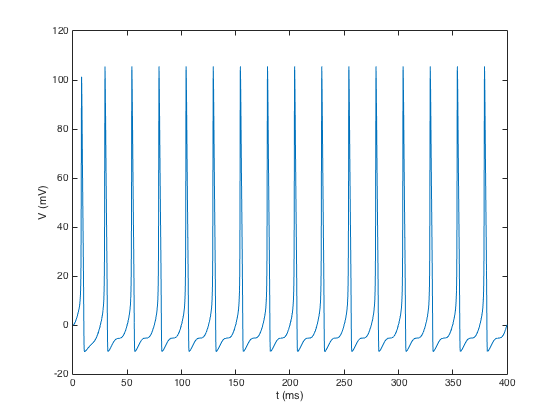
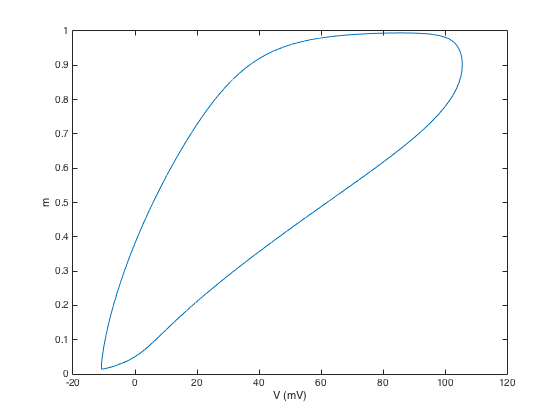
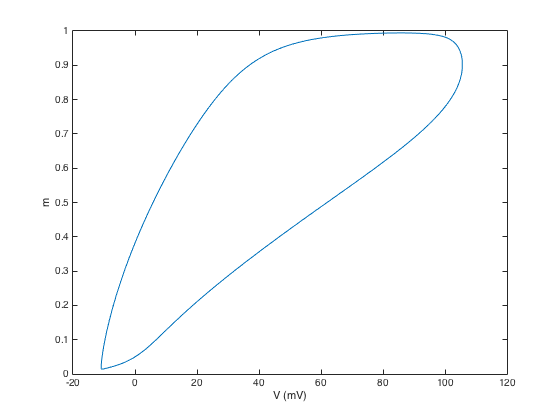
After extracting the archive, starting matlab, then in the matlab
command prompt changing to the extracted folder and typing "code" you
should get these default graphs of voltage trajectory in time and
phase plane which has the modulation frequency at 40 Hz:
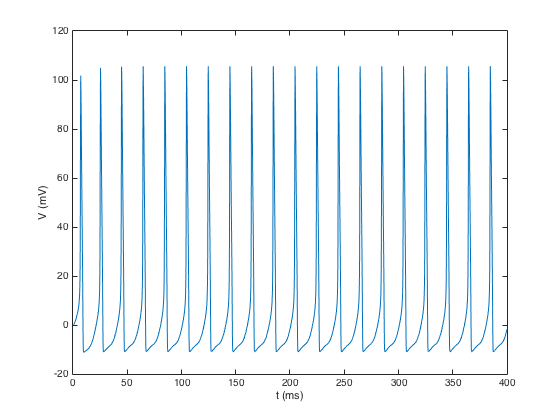
 changing the frequency to 50 Hz on line 16 produces a graph similar to
the time voltage trace in figure 3B in the paper:
changing the frequency to 50 Hz on line 16 produces a graph similar to
the time voltage trace in figure 3B in the paper:
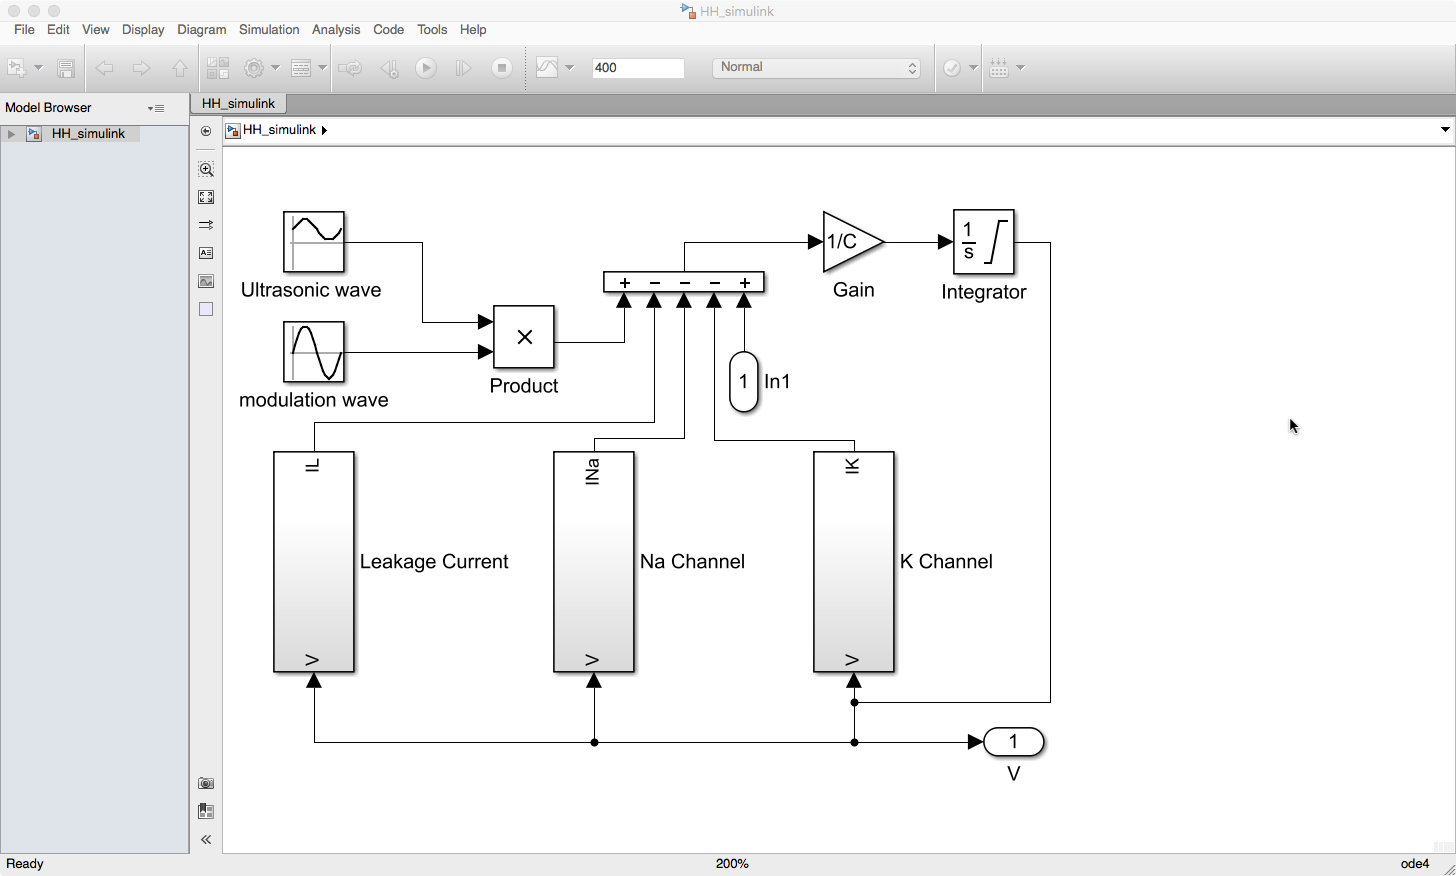
 You can also open the simulink model which displays the model
similarly to figure 1 in the paper.
You can also open the simulink model which displays the model
similarly to figure 1 in the paper.