Readme file
The present files complement the paper: Balbi P, Massobrio P, Hellgren-Kotaleski J. A single Markov-type kinetic model accounting for the macroscopic currents of all human voltage-gated sodium channel isoforms. PLoS Compu Biol http://doi.org/10.1371/journal.pcbi.1005737 By adopting a unifying and simplified Markov-type kinetic model, the simulation replicates the detailed electrophysiological behavior of each and every human voltage-gated sodium channels (VGSC, from Nav1.1 to Nav1.9), In particular, current-voltage (or intensity-voltage) curves, current-voltage relationships, fast inactivation availability, recovery from inactivation, in each VGSC isomer are here reproduced. For help in running the NEURON code please see: https://senselab.med.yale.edu/ModelDB/NEURON_DwnldGuide.htm The mosinit.hoc file starts the 1. I_V curves.hoc file described below. 1. I_V curves.hoc. Choose the Nav isomers (1 to 9, Panel 'Avvio' (’Start’) in Italian) you want to display. By clicking on start button the program draws the intensity/voltage curves. You can change the voltage increments, the starting and ending voltages, as well as the duration of voltage clamps, and other parameters.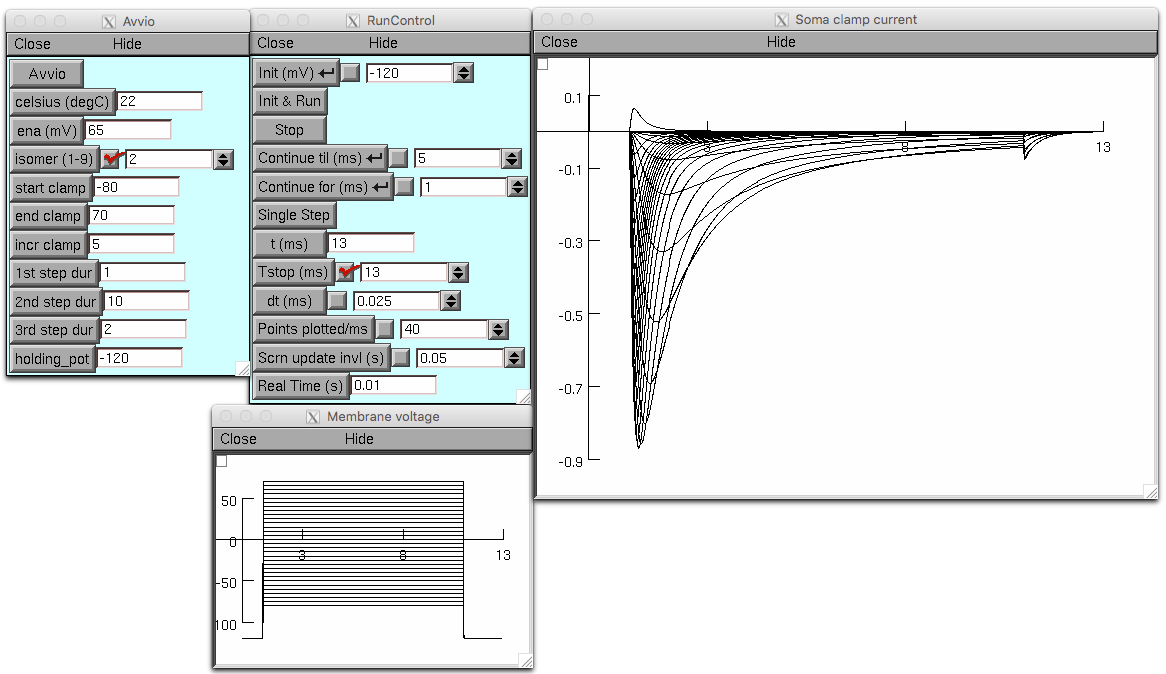 2. I_V rel.hoc. The program draws the current/voltage relationship,
according to the chosen isomer (Panel ‘Avvio’). By choosing an isomer,
the code also automatically sets different parameters up for correctly
displaying the curves. Click the button ‘Avvio’ to start the
simulation. The clamping increment is 1 mV. If a slower simulation
speed is requested, try to reduce the dt. The obtained Normalized
conductance relation curve can be fitted by means of MultiRunFitter
subroutine (see paper for fitting equations). See also the interpreter
console for some numerical values.
3. I_V_f_inact.hoc. Steady-state fast inactivation (also called
availability) dependence from voltage. Functioning and buttons as
above (more or less). Use MultiRunFitter with the Normalized curve,
too. Click display button (scroll down the panel if not visible) to
see the curves during the calculation (can significantly slow down the
elaboration).
4. rec_f_inact. Recovery from (fast) inactivation (also called
repriming). Functioning and buttons as above, you got it.
Use of the model: load each single .hoc file (1 to 4), according to
the electrophysiological data set (current-voltage curves,
current-voltage relationship, fast inactivation availability, recovery
from inactivation) you want to display.
For the corresponding experimental values and protocols, please refer
to the literature cited in the accompanying paper, or to file
5. References to the experimental data.
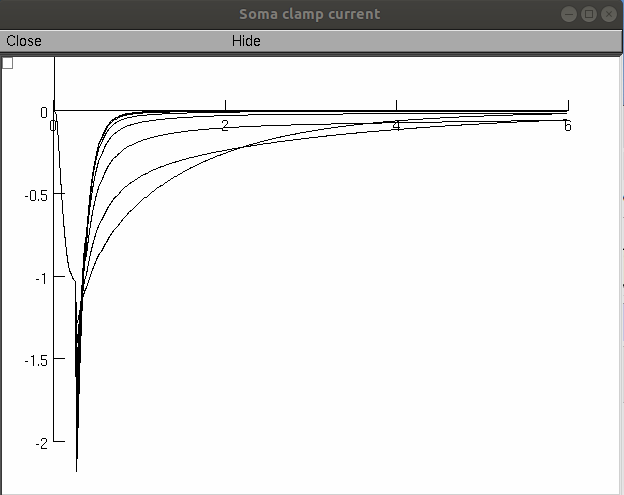
6. fig2g.hoc 20190614 Contribution from Carol Upchurch (confirmed by
Pietro Balbi) reproduces Figure 2G in the paper. Note the units in
the paper figure are ms on the x axis and mA/cm2 on the y-axis (the
extra (typo) scale bar in the inset only applies to the paper figure on the
right (real data).
2. I_V rel.hoc. The program draws the current/voltage relationship,
according to the chosen isomer (Panel ‘Avvio’). By choosing an isomer,
the code also automatically sets different parameters up for correctly
displaying the curves. Click the button ‘Avvio’ to start the
simulation. The clamping increment is 1 mV. If a slower simulation
speed is requested, try to reduce the dt. The obtained Normalized
conductance relation curve can be fitted by means of MultiRunFitter
subroutine (see paper for fitting equations). See also the interpreter
console for some numerical values.
3. I_V_f_inact.hoc. Steady-state fast inactivation (also called
availability) dependence from voltage. Functioning and buttons as
above (more or less). Use MultiRunFitter with the Normalized curve,
too. Click display button (scroll down the panel if not visible) to
see the curves during the calculation (can significantly slow down the
elaboration).
4. rec_f_inact. Recovery from (fast) inactivation (also called
repriming). Functioning and buttons as above, you got it.
Use of the model: load each single .hoc file (1 to 4), according to
the electrophysiological data set (current-voltage curves,
current-voltage relationship, fast inactivation availability, recovery
from inactivation) you want to display.
For the corresponding experimental values and protocols, please refer
to the literature cited in the accompanying paper, or to file
5. References to the experimental data.
6. fig2g.hoc 20190614 Contribution from Carol Upchurch (confirmed by
Pietro Balbi) reproduces Figure 2G in the paper. Note the units in
the paper figure are ms on the x axis and mA/cm2 on the y-axis (the
extra (typo) scale bar in the inset only applies to the paper figure on the
right (real data).
 Changelog: