This code reproduces several figures of Mejias et al., Science Advances 2, e1601335, 2016.
All code, unless specified otherwise, developed by Jorge Mejias.
Indications of importance before using this code:
-The code is for personal use only, and it is aimed at providing help in reproducing the results of Mejias et al. 2016. If something in it is unclear, please go to the original publication and supplementary material, or contact the author at j.f.mejias@uva.nl.
-Each folder contains the code needed to reproduce part of the indicated figure. Figure 5 and 6 require the use of the MVGC Matlab Toolbox by Anil Seth, which can be obtained here: https://users.sussex.ac.uk/~lionelb/MVGC/html/mvgchelp.html
-Fig. 6 requires the use of anatomical data from the Kennedy lab, which can be freely obtained here: core-nets.org
-Fig. 7 can be obtained using the code for Fig. 6 with minor adjustments.
Any questions may be sent to Jorge Mejias: j.f.mejias@uva.nl.
Usage Instructions: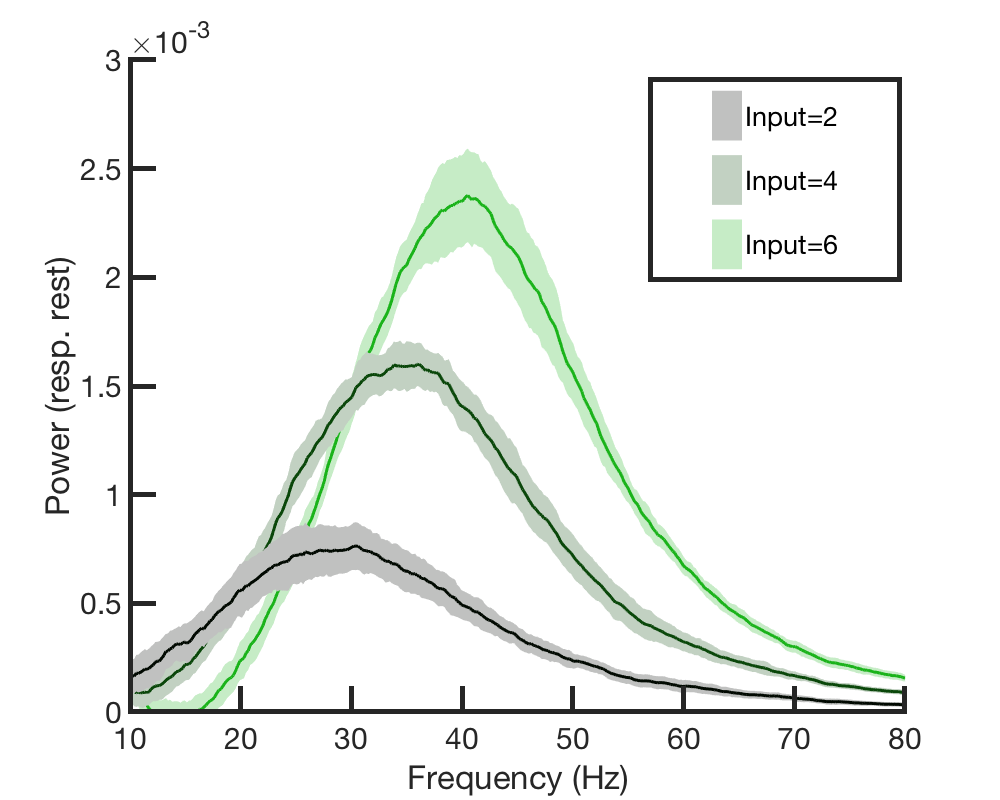 Figure 3b:
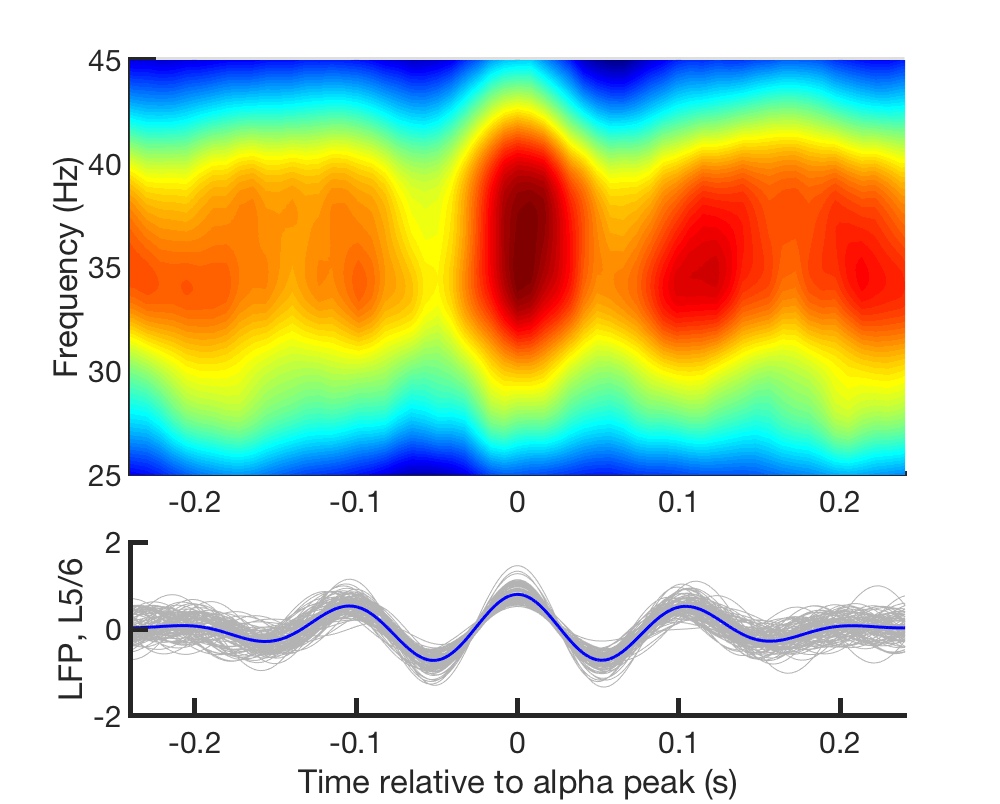 Figure 4bc:
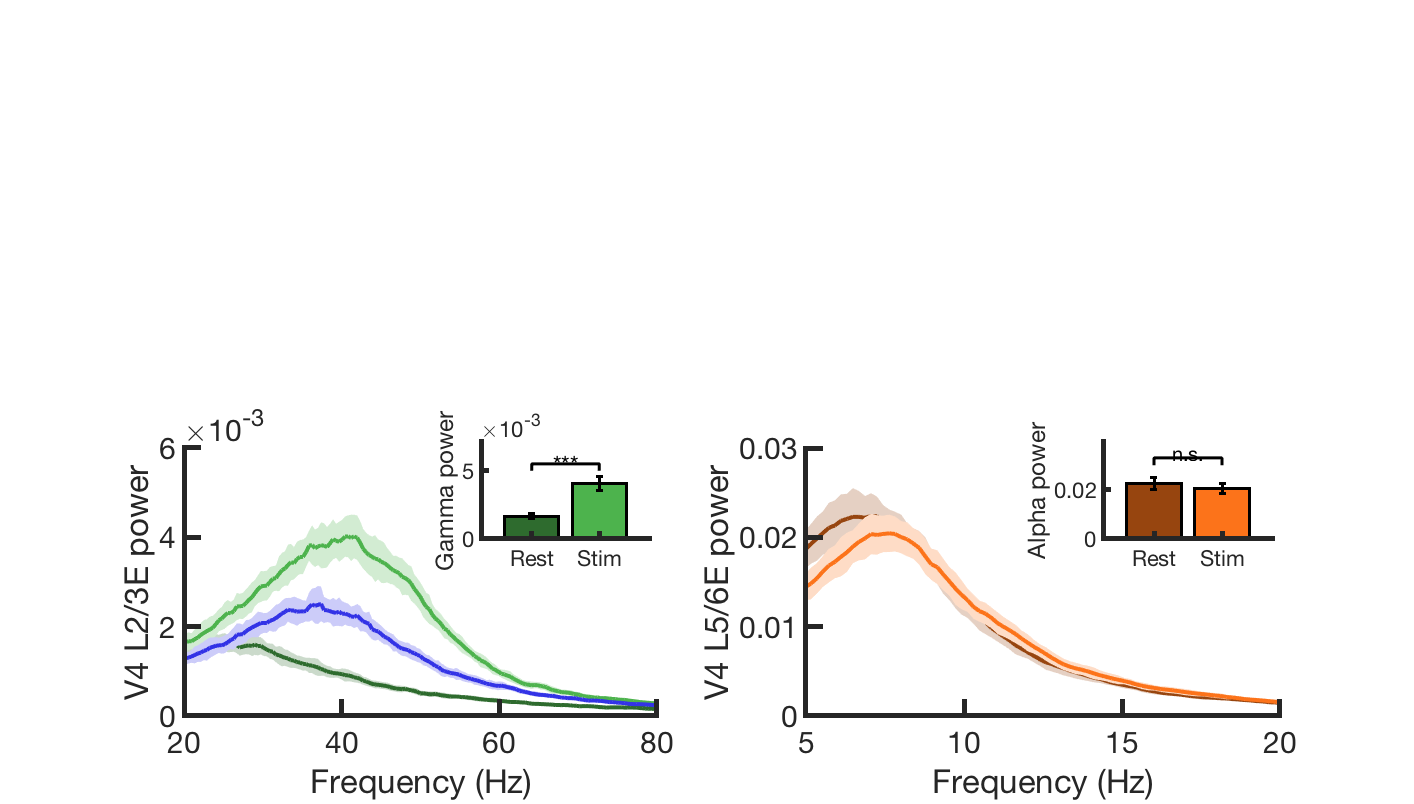 Figure 4ef:
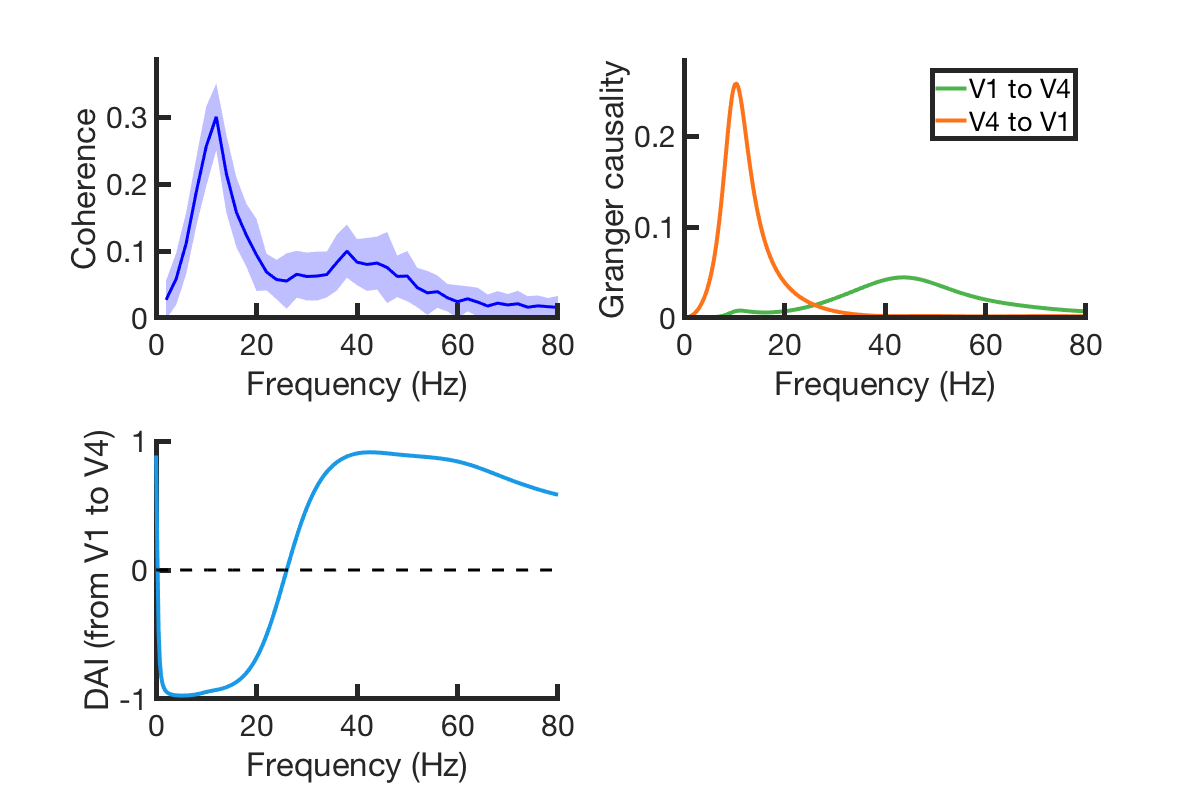
 Figure 5: