Make sure you have a working Python and MPI (for parallel computing) installation, then:
For Linux and macOS: pip3 install neuron; for Windows, download the installer from neuron.yale.edu.
go to directory nociception_modeling
nrnivmodl ./mod
After succesful compile you can see:
Successfully created x86_64/special
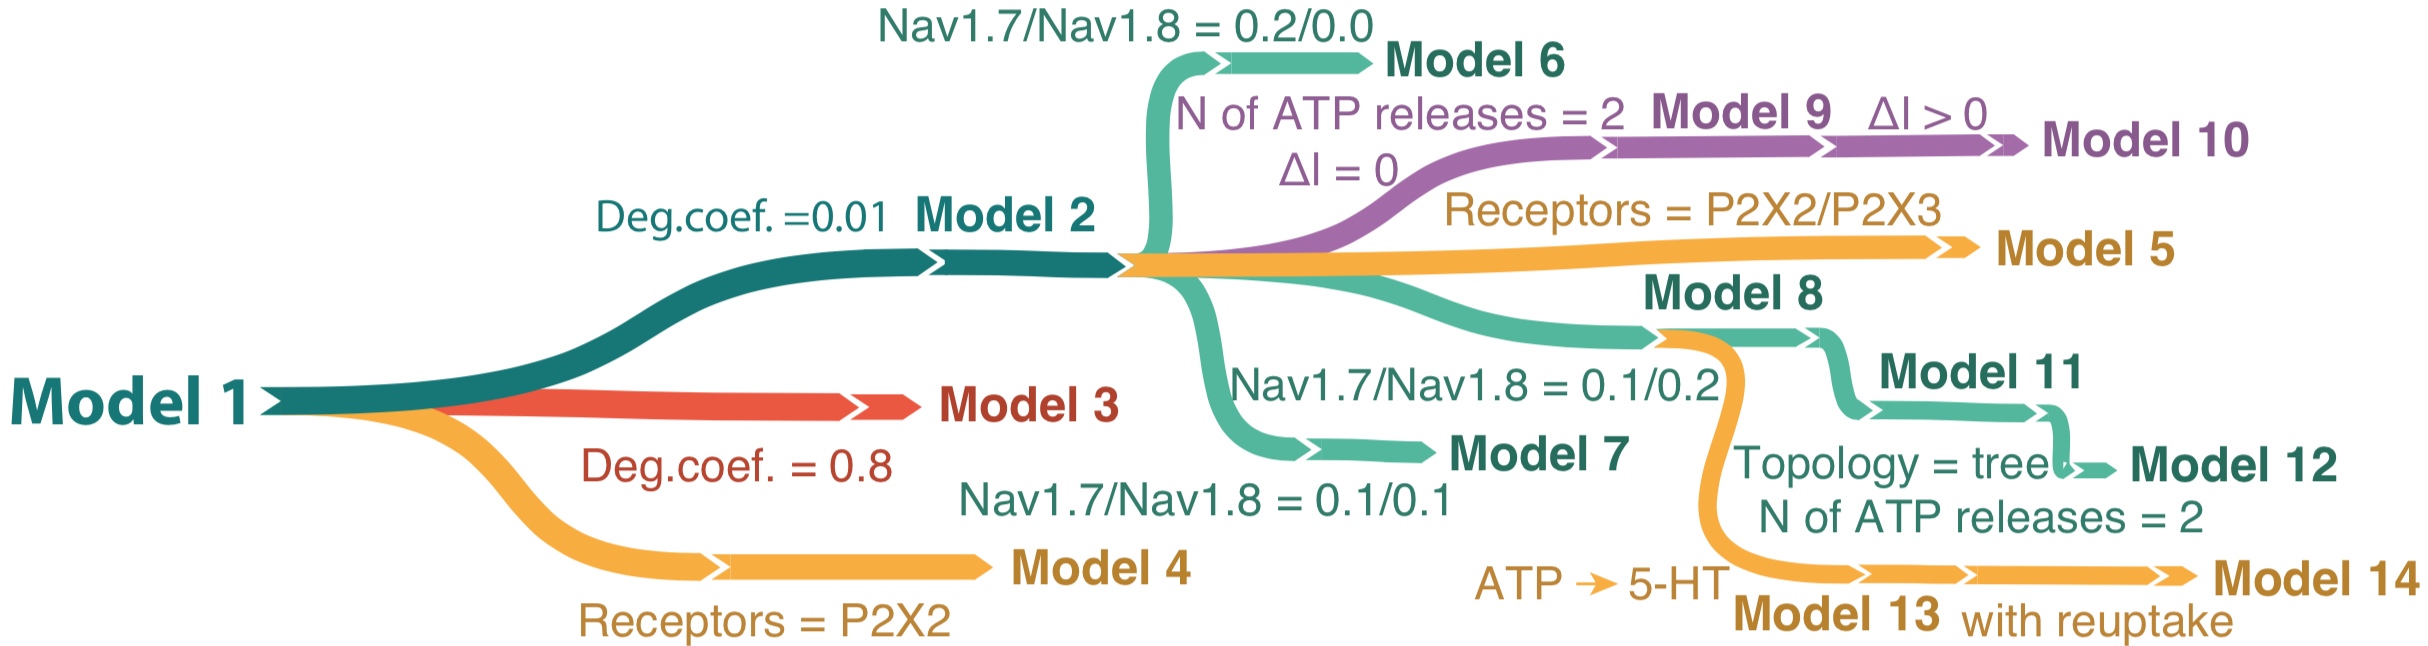
nrniv -python onefibersimulation.py 2[number of model]
If everything is ok you'll see similar output:
	stimsec[118] connect stimsec[119] (0), 1
	/* First segment only */
	insert capacitance { cm=1}
	insert navv1p8 { gbar_navv1p8=0.2 celsiusT_navv1p8=37}
	insert extrapump { pumpik_extrapump=0 pumpina_extrapump=0}
	insert koi { kiinf_koi=121.7 koinf_koi=5.6 theta_koi=0.029}
	insert naoi { naiinf_naoi=11.4 naoinf_naoi=154 theta_naoi=0.029}
	insert morphology { diam=1}
	insert nakpump { nain_nakpump=11.4 kout_nakpump=5.6 smalla_nakpump=-0.0047891 b1_nakpump=1 kvotqt_nakpump=0}
	insert nattxs { gbar_nattxs=0.1 celsiusT_nattxs=37 Tshift_nattxs=0}
	insert kdr { gbar_kdr=0.01 vhalfn_kdr=13}
	insert kad { gbar_kad=0.1}
	insert kap { gbar_kap=0.1}
	insert leak { gkleak_leak=0 gnaleak_leak=0}
	insert k_ion {}
	insert Nav1_3 { gbar_Nav1_3=0.2 BBiD_Nav1_3=122}
	insert na_ion {}
	insert extracellular { xraxial=1e+09 xg=1e+09 xc=0 e_extracellular=0}
	insert AtP_42 { Deff=0.8 c0cleft=1 h=15250.1 tx1=10 k=0.01 initial=0}
	insert p2x3 { K1=120000 L1=20 K2=80000 L2=40 K3=40000 L3=60 K4=70 L4=1 R4=1e-05 D4=1e-05 R3=1e-05 D3=1e-05 R2=1e-05 D2=0.2 R5=0.0001 R1=0.0002 D1=0.001 D5=23 M4=0.0001 N3=0.0255 M3=8000 N2=0.017 M2=16000 N1=0.0085 M1=24000 gmax=12 Ev=5}
}
Number of model -  8
>>>
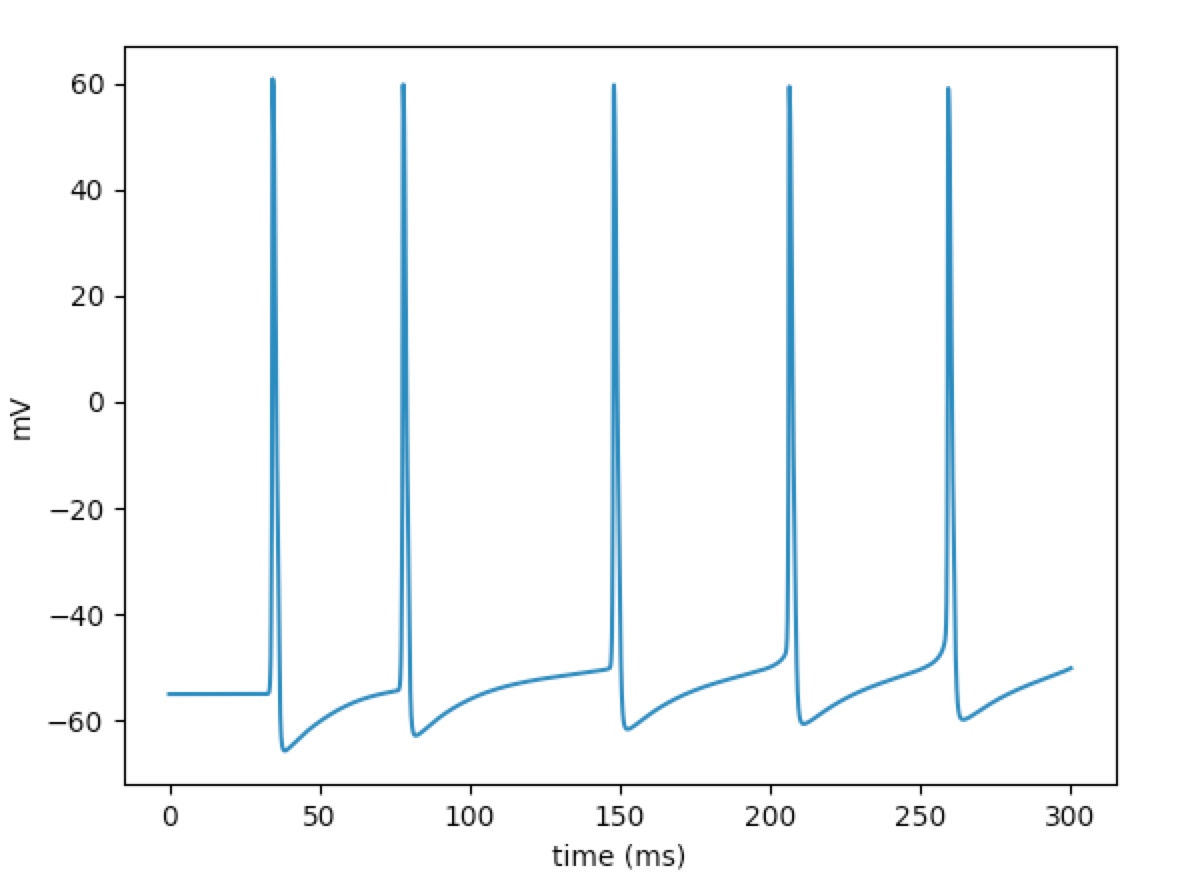
After simulation you can see the voltage graph of TG:
This is for 8th model
Duration of simulation is about a minute usually, but, notice, the duration of the 9th model simulation is about 2 hours because of tstop of this simulation is 2min. Also, the running time depends on computer performance.
For complex activity simulation we recommend to use parallel computing, but even in this case calcutation takes from 12 hours to few days, calculation time depends on computer performance and number of threads. Notice, number of threads shouldn't be more then number of C-fibers.
Before run parallel calculation, please, make the directory for recorded results:
mkdir results
To run parallel calculation, please, use this command:
mpiexec -n 2 nrniv -mpi -python parallelsimulation.py 10[number of fibers] [range of model included in calculation:] 2[start range] 8[end range]
For persistent ATP application we use range of model: 5...8
For persistent 5-HT application we use range of model: 13...14
If everything is ok you'll see similar output:
NEURON -- VERSION 7.6.2 master (f5a1284) 2018-08-15
Duke, Yale, and the BlueBrain Project -- Copyright 1984-2018
See http://neuron.yale.edu/neuron/credits

Additional mechanisms from files
 ./mod//5ht.mod ./mod//DNav18.mod ./mod//Nav17_a.mod ./mod//Nav18_a.mod ./mod//Nav1_3.mod ./mod//atp4.mod ./mod//atp42.mod ./mod//extrapump.mod ./mod//k_ion_dynamics.mod ./mod//kadist.mod ./mod//kaprox.mod ./mod//kdr.mod ./mod//kf.mod ./mod//kna.mod ./mod//ks.mod ./mod//leak.mod ./mod//na1p8.mod ./mod//na_ion_dynamics.mod ./mod//nakpump.mod ./mod//nattxs.mod ./mod//nav18.mod ./mod//nav1p9.mod ./mod//p2x2.mod ./mod//p2x3.mod ./mod//p2x32.mod ./mod//serotonin.mod ./mod//slow5HT.mod ./mod//slowATP.mod
ls: /usr/local/bin/../lib/libpython*.dylib: No such file or directory
- - - - - - - - - -
start
- - - - - - - - - -
start
- - - - - - - - - -
end
- - - - - - - - - -
end
<_io.TextIOWrapper name='out.spk' mode='w' encoding='UTF-8'>
<_io.TextIOWrapper name='out.spk' mode='a' encoding='UTF-8'>
After simulation spiketimes and extracellular voltages of each fiber are recorded in /results directory. Out.spk file is spiketimes, you can open this file with any text editor. File in format 'vext%d[number of neuron in thread]r%d[number of thread]' is extracellular voltage for one C-fiber. You can plot graphs in any convenient way.
Note: the original GitHub repo for this project is at: https://github.com/research-team/pain