This is the model used in:

Chambers, J. D., J. C. Bornstein, et al. (2014). "A detailed,
conductance based computer model of intrinsic sensory neurons of the
gastrointestinal tract." Am J Physiol Gastrointest Liver Physiol. pii:
ajpgi.00228.2013. [Epub ahead of print]

These simulations require the NEURON simulator available for free from
http://www.neuron.yale.edu

To run the model, first compile all the files in the ./mod directory
(for example, type "nrnivmodl ./mod" at the command line after
changing into in the directory containing the model). Then run one of
the relevent (fig1.hoc, fig2.hoc, etc.) hoc files by typing "nrngui
fig1.hoc" at the command line or by opening neuron and using the
load_file function.

Each of the fig#.hoc files will produce a graph of the membrane
potential (or membrane current for Fig5.hoc) and produce 2 output
files. The output file fig#mem.txt contains time in the first column
and membrane potential in the second column. The output file
fig#currents.txt contains time in the first first column and currents
or concentrations in the subsequent columns (see individual hoc file
for details).

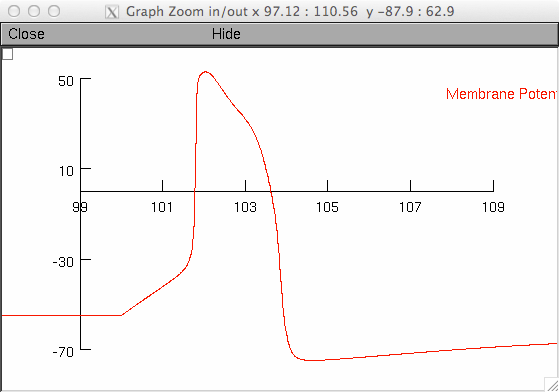
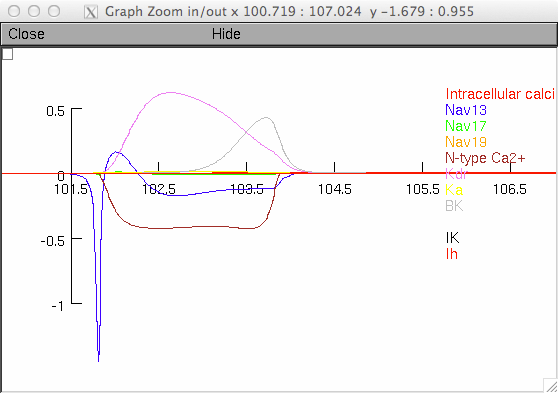
Fig1.hoc will also produce a second graph of the currents in the
model (1A, 1B):


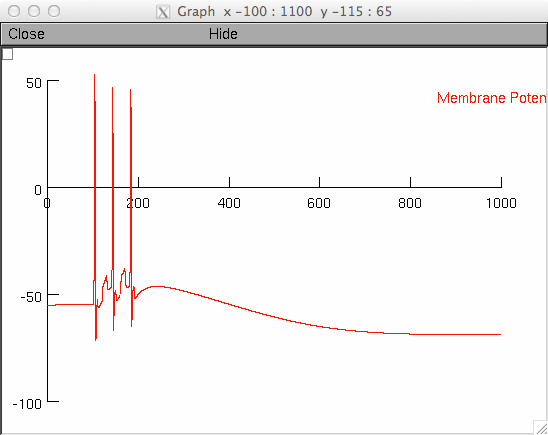
Fig2.hoc will produce Panel C2:


Comment out the stimuli in the hoc to produce Panels A2 and
B2. Uncomment conductance changes highlighted in the hoc file to
produce Panel D2.

Fig3.hoc can take command line arguments. For example, to change the
strength of the depolarising current pulse use "nrngui -c stimamp=150
fig3.hoc" for a 150 pA depoalrising current or "nrngui -c stimamp=350
fig3.hoc" for a 350 pA depolarising current. The total conductance of
all currents (and parameters of Ih varied in Figure 8) can also be
altered using command line arguments. For example, "nrngui -c
gnav13=500 fig3.hoc" will change the total conductance of Nav1.3 (for
a full list of variables see Define default variables section of the
fig3.hoc). The value of the variable is divided by 1000 (or 100 for
properties of Ih another than total conductance, see conductance
changes section of fig3.hoc for details) and then multiplied with the
baseline value for that current. So, passing a value of 500 for gnav13
decreases the total conductance to half, whereas passing a value of
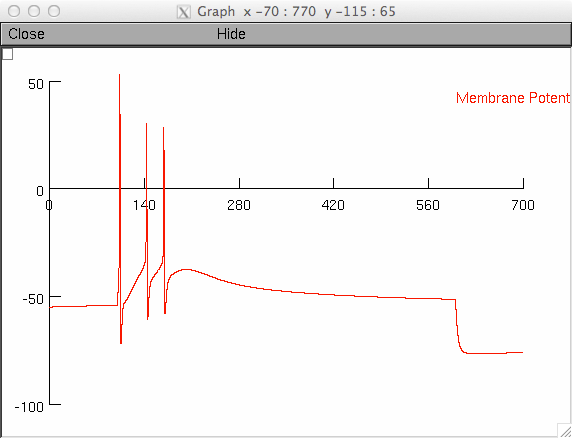
2000 will double the total conductance. Without modification Fig3.hoc
produces a graph like Fig3C2:


 Fig2.hoc will produce Panel C2:
 Comment out the stimuli in the hoc to produce Panels A2 and
B2. Uncomment conductance changes highlighted in the hoc file to
produce Panel D2.
Fig3.hoc can take command line arguments. For example, to change the
strength of the depolarising current pulse use "nrngui -c stimamp=150
fig3.hoc" for a 150 pA depoalrising current or "nrngui -c stimamp=350
fig3.hoc" for a 350 pA depolarising current. The total conductance of
all currents (and parameters of Ih varied in Figure 8) can also be
altered using command line arguments. For example, "nrngui -c
gnav13=500 fig3.hoc" will change the total conductance of Nav1.3 (for
a full list of variables see Define default variables section of the
fig3.hoc). The value of the variable is divided by 1000 (or 100 for
properties of Ih another than total conductance, see conductance
changes section of fig3.hoc for details) and then multiplied with the
baseline value for that current. So, passing a value of 500 for gnav13
decreases the total conductance to half, whereas passing a value of
2000 will double the total conductance. Without modification Fig3.hoc
produces a graph like Fig3C2:
