26/07/2008 Maarten H.P.Kole
This model reproduces Figure 6a of the article
"Action potential generation requires a high sodium channel density in
the axon initial segment". Nature Neuroscience 11(2):178-86
(2008).
http://www.nature.com/neuro/journal/v11/n2/abs/nn2040.html
The example simulation shows that even with specific
voltage-dependence of axonal Na+ channels a channel density of
~50-fold higher is required for robust initiation in the AIS.
The voltage-dependence of activation and inactivation of the Na+
channels are constrained by the experimentally measured properties of
the somato-dendritic (SD) and axon initial segment (AIS) Na+
channels. These two populations are defined within the "na.mod" and
"nax.mod" files, respectively, and based on Hodgkin-Huxley
formalism. Details on the specific channel kinetics and properties can
be found in the Supplementary Information of the paper. The mod file
was obtained from Mainen and Sejnowski (1996).
When the folder is compiled using the mknrndll script the simulation
can be started with "mosinit.hoc".
For questions please contact maarten.kole@anu.edu.au
Example usage: auto-launch the simulation from ModelDB or download and
extract the archive and then under
linux/unix:
-----------
Compile the mod files by cd'ing to NN_kole and running nrnivmodl.
Start the simulation with
nrngui mosinit.hoc
MAC OS X:
---------
Drag and drop the NN_kole folder onto the mrknrndll icon. Drag and
drop the mosinit.hoc file onto the nrngui icon.
Windows:
--------
Compile the mod files by starting mknrndll, changing directory to the
NN_kole folder and selecting to make the nrnmech.dll. Double click on the
mosinit.hoc file in a windows explorer window.
Once the simulation is started:
-------------------------------
The morphology of the cell
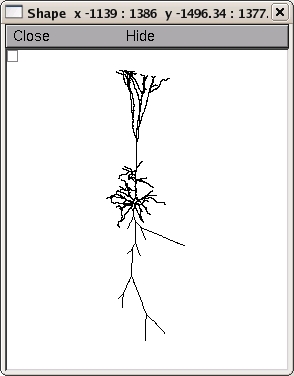 an instantaneous plot of the voltage as a function of distance
thoughout the cell, and other windows appear.
You can recreate figure 6a left from the publication by pressing Init & Run
in the RunControl Box.
Select "Keep lines" in the voltage graph (drag from empty box
in the upper left corner and release mouse button on this menu item),
and, optionally, select to change the v(0.5) trace to a black dotted
line (use the Color/Brush menu item on the previous menu list, select
a black line and a dotted line and then click on the v(.5) text on the
graph).
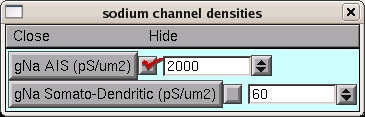
Then changing the channel density by typing the new values into the
box:
an instantaneous plot of the voltage as a function of distance
thoughout the cell, and other windows appear.
You can recreate figure 6a left from the publication by pressing Init & Run
in the RunControl Box.
Select "Keep lines" in the voltage graph (drag from empty box
in the upper left corner and release mouse button on this menu item),
and, optionally, select to change the v(0.5) trace to a black dotted
line (use the Color/Brush menu item on the previous menu list, select
a black line and a dotted line and then click on the v(.5) text on the
graph).
Then changing the channel density by typing the new values into the
box:
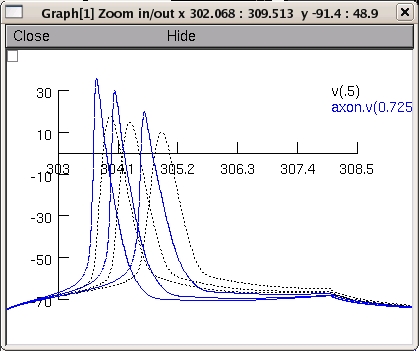
 and then press Init & Run again. Repeat with the remaining value
(simulation starts with 3000 so you will have to run with 4000 and
2000. When done the graph should look like:
and then press Init & Run again. Repeat with the remaining value
(simulation starts with 3000 so you will have to run with 4000 and
2000. When done the graph should look like: