This is the readme.txt for the models associated with the paper
Huang CW, Cheng JT, Tsai JJ, Wu SN, Huang CC. Diabetic hyperglycemia
aggravates seizures and status epilepticus-induced hippocampal damage.
Neurotox Res (2009) 15:71-81.
Abstract:
Epileptic seizures in diabetic hyperglycemia (DH) are not
uncommon. This study aimed to determine the acute behavioral,
pathological, and electrophysiological effects of status epilepticus
(SE) on diabetic animals. Adult male Sprague-Dawley rats were first
divided into groups with and without streptozotocin (STZ)-induced
diabetes, and then into treatment groups given a normal saline (NS)
(STZ-only and NS-only) or a lithium-pilocarpine injection to induce
status epilepticus (STZ + SE and NS + SE). Seizure susceptibility,
severity, and mortality were evaluated. Serial Morris water maze test
and hippocampal histopathology results were examined before and 24 h
after SE. Tetanic stimulation-induced long-term potentiation (LTP) in
a hippocampal slice was recorded in a multi-electrode dish system. We
also used a simulation model to evaluate intracellular adenosine
triphosphate (ATP) and neuroexcitability. The STZ + SE group had a
significantly higher percentage of severe seizures and SE-related
death and worse learning and memory performances than the other three
groups 24 h after SE. The STZ + SE group, and then the NS + SE group,
showed the most severe neuronal loss and mossy fiber sprouting in the
hippocampal CA3 area. In addition, LTP was markedly attenuated in the
STZ + SE group, and then the NS + SE group. In the simulation,
increased intracellular ATP concentration promoted action potential
firing. This finding that rats with DH had more brain damage after SE
than rats without diabetes suggests the importance of intensively
treating hyperglycemia and seizures in diabetic patients with
epilepsy.
--------------------------
To run the model:
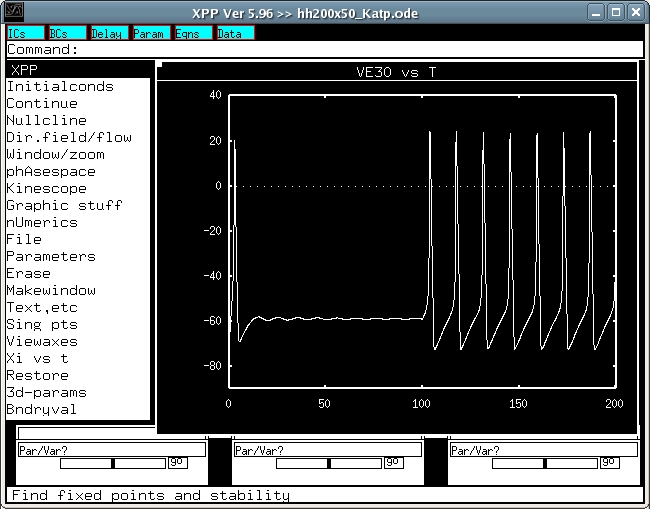
XPP: start with the command
xpp ode\hh200x50_Katp.ode
(or xppaut hh200x50_Katp.ode)
Mouse click on Xi vs t, and change to VE30
then, click on Initialconds, and then (G)o.
This makes a trace similar to fig 6A in the paper of Huang et al.
 Mouse click Viewaxes, and Array. After appropriate changes, a figure
similar to Fig 6B should appear.
Bard Ermentrout's website http://www.pitt.edu/~phase/
describes how to get and use xpp (Bard wrote xpp).
The model file was submitted by:
Dr. Sheng-Nan Wu
Department of Physiology
Natl Cheng Kung U Med Coll
Tainan 70101, Taiwan
Mouse click Viewaxes, and Array. After appropriate changes, a figure
similar to Fig 6B should appear.
Bard Ermentrout's website http://www.pitt.edu/~phase/
describes how to get and use xpp (Bard wrote xpp).
The model file was submitted by:
Dr. Sheng-Nan Wu
Department of Physiology
Natl Cheng Kung U Med Coll
Tainan 70101, Taiwan