This is the readme.txt for the models associated with the paper.
Huang CW, Tsai JJ, Huang CC, Wu SN. Experimental and simulation
studies on the mechanisms of levetiracetam-mediated inhibition of
delayed-rectifier potassium current (KV3.1): contribution to the
firing of action potentials.J Physiol Pharmacol (2009) in press.
Levetiracetam (LEV) is an S-enantiomer pyrrolidone derivative with
established antiepileptic efficacy in generalized epilepsy and partial
epilepsy. However, its effects on ion currents and membrane potential
remain largely unclear. In this study, we investigated the effect of
LEV on differentiated NG108-15 neurons. In these cells treated with
dibutyryl cyclic AMP, the expression level of the KV3.1 mRNA was
elevated. With the aid of patch clamp technology, we found that LEV
was able to suppress the amplitude of delayed rectifier K+ current
(IK(DR)) in a concentration-dependent manner with an IC50 value of 37
uM in differentiated NG108-15 neurons. LEV (30 uM) shifted the
steady-state activation of IK(DR) to a more positive potential by 10
mV, without shifting the steady-state inactivation of IK(DR). Neither
Na+, nor erg (ether-a-go-go -related)-mediated K+ and ATP-sensitive K+
currents were affected by LEV (100 uM). LEV increased the duration of
action potentials in current clamp configuration. Simulation studies
In a modified Hodgkin-Huxley neuron and network unraveled that the
reduction of slowly inactivating IK(DR) resulted in membrane
depolarization accompanied by termination of the firing of action
potentials in a stochastic manner. Therefore, the inhibitory effects
on slowly inactivating IK(DR) (Kv3.1-encoded current) may constitute
one of the underlying mechanisms through which LEV affects neuronal
activity in vivo.
To run the models:
XPP: start with the command
xppaut hh200x50-LEV01.ode
(or similar)
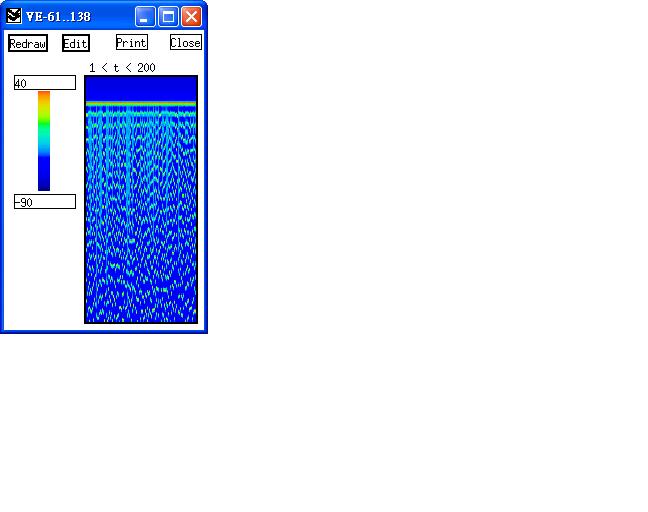
This simulation will make graphs similar to figure 10A in the paper of
Huang et al.
From Viewaxes, select Array, then assign to: column 1: VE0, Ncols:
200, Row 1: 10, NRows: 200, Rowskip:10, Zmin: -90, Zmax: 40
Back at the main menu select "Xi vs t", then change VE0 to VE4,
finally select Initalconds -> Go to generate the following graphs:
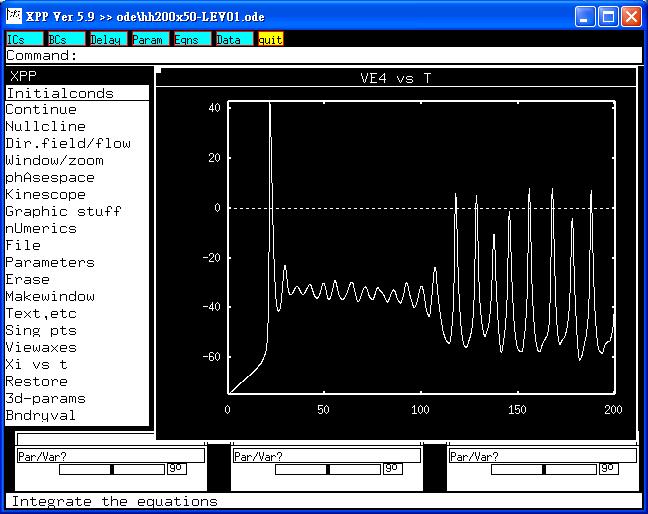 When gk3 was changed to 4 and eta to 10, graphs will be similar to
Figure10B.
Bard Ermentrout's website http://www.pitt.edu/~phase/ describes how to
get and use xpp.
These model files were submitted by:
Drs. Sheng-Nan Wu and Chin-Wei Huang
National Cheng Kung University Medical College
Tainan 70101, Taiwan
snwu@mail.ncku.edu.tw
When gk3 was changed to 4 and eta to 10, graphs will be similar to
Figure10B.
Bard Ermentrout's website http://www.pitt.edu/~phase/ describes how to
get and use xpp.
These model files were submitted by:
Drs. Sheng-Nan Wu and Chin-Wei Huang
National Cheng Kung University Medical College
Tainan 70101, Taiwan
snwu@mail.ncku.edu.tw