This is the readme for the model associated with paper:
Kim et al. PLoS Comp Biol 2010
(Models of Second Messenger Pathways in CA1 pyramidal cell)
Recreating traces for figure 2A in the paper:
To run this xpp (see http://www.math.pitt.edu/~bard/xpp/xpp.html
for downloading xpp) model in linux download and extract this archive,
then in the new folder type xppaut Manuscript_Ref_addCaMalt.ode
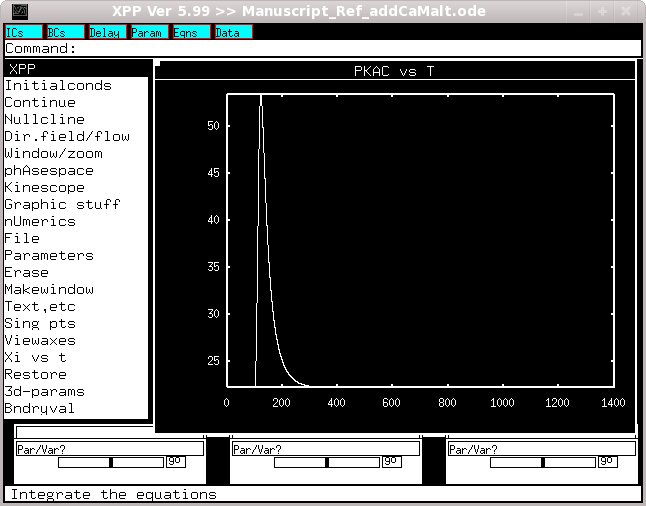
Select InitalConds -> (G)o. After a while the simulation will complete.
Select Xi vs t and enter PKAc. You should then see a graph like
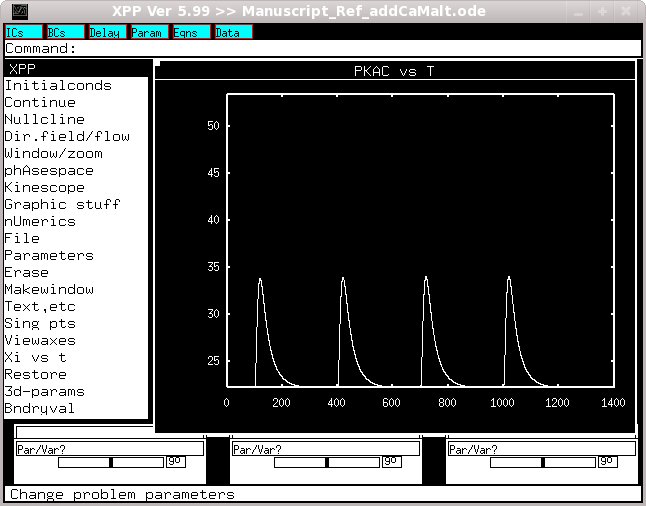
 If you then change t2 to 400, t3 to 700 and t4 to 1000 you should get
the next trace if you plot PKAc. The changes can be made either by
selecting Parameters and entering them by hand (enter a blank line
when complete and then select Initalconds -> (G)o) or by uncommenting
line 16 in the code and commenting line 18 and restarting the
simulation. When complete you should see a figure like
If you then change t2 to 400, t3 to 700 and t4 to 1000 you should get
the next trace if you plot PKAc. The changes can be made either by
selecting Parameters and entering them by hand (enter a blank line
when complete and then select Initalconds -> (G)o) or by uncommenting
line 16 in the code and commenting line 18 and restarting the
simulation. When complete you should see a figure like
 The two simulations that are run to generate these figures also
produce the data for Figures 2B (molecule Qact), 5B1 and B2 (molecule
cAMP). Figure 5A1 and A2 are produced by adding up AC1Cam, AC1CamATP,
and ECamATP.
Figure S4A can be produced by plotting Qact for the simulation run
with 300 s intertrial interval (used for Figure 2B) and then repeating
that with cam_rate = 0.
This model was contributed by Dr K.T. Blackwell
The two simulations that are run to generate these figures also
produce the data for Figures 2B (molecule Qact), 5B1 and B2 (molecule
cAMP). Figure 5A1 and A2 are produced by adding up AC1Cam, AC1CamATP,
and ECamATP.
Figure S4A can be produced by plotting Qact for the simulation run
with 300 s intertrial interval (used for Figure 2B) and then repeating
that with cam_rate = 0.
This model was contributed by Dr K.T. Blackwell