Quantitative interactions between the A-type K+ current and inositol
trisphosphate receptors regulate intraneuronal Ca2+ waves and synaptic
plasticity
This is an implementation of the following paper:
Ashhad S and Narayanan R. Quantitative interactions between the A-type
K+ current and inositol trisphosphate receptors regulate intraneuronal
Ca2+ waves and synaptic plasticity. J Physiology April 2013, Volume
591, Issue 7, pages 1645-1669,
DOI: 10.1113/jphysiol.2012.245688
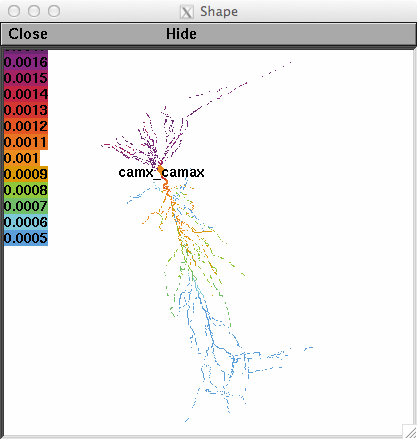
This is an implementation of intraneuronal calcium waves and
metabotropic glutamate receptors (mGluR) in a morphologically
reconstructed model of CA1 pyramidal neuron. The simulation
environment is NEURON (freely available from
http://www.neuron.yale.edu). The MOD files for this implementation
were either taken/modified from previous studies or written for this
study. Implemented by: Sufyan Ashhad (sufyan.ashhad@gmail.com,
soofy@mbu.iisc.ernet.in) and Rishikesh Narayanan.
Usage:
If auto-launched from ModelDB select the corresponding checkbox to the
below mentioned files. The below describes running in the mswin
environment. Clicking on the Fig4F-G.hoc can run the simulation for
the calcium waves. This will generate Figs 4F-G from the paper:
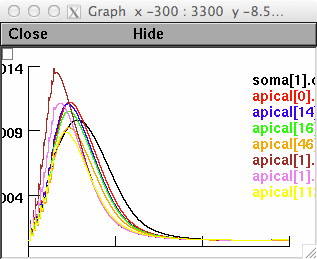
 However, note that the color code for the figure 4F,in the paper, is
not the same as in the figure that NEURON generates. This is because
NEURON uses different sets of colors to specify different
traces. Traces in the paper were re colored for better visibility and
representation. Another difference is in the annotation of these
traces. Default annotation in NEURON uses compartment name and
location of the segment within that compartment to represent the
variable being recorded. In the paper this annotation was simplified
and compartments were categorized into soma, apical trunk (Trunk) and
oblique dendrites (Oblique) and their respective distances from
soma/branch points (in the case of obliques) was given. However the
order of the traces (in terms of annotation, from top to bottom) is
the same in the paper as well as in the figure generated by running
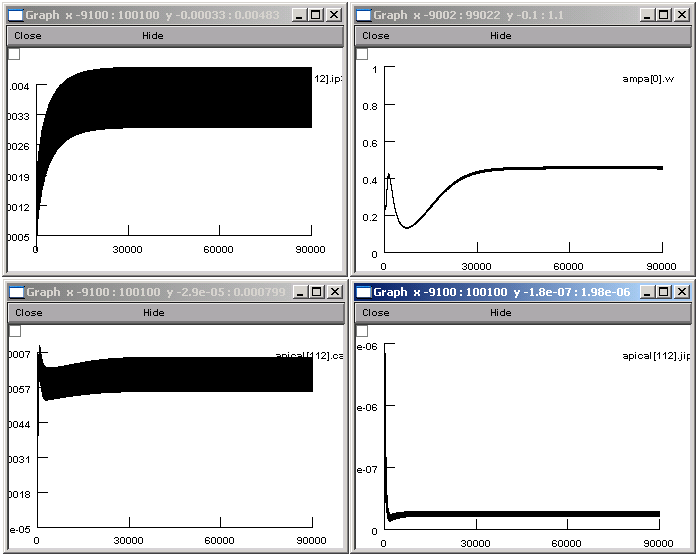
this program. Clicking of Fig6C-F.hoc will run the simulation for the
figures 6C-F in the paper. These correspond to the black traces in
each panel and represent the condition when both NMDAR and mGluR are
present as sources of calcium elevation in the postsynaptic
compartment. To run this simulation, please make the 'Clamp Amplitude'
to be 0 in the 'parameters' panel that comes up after running
Fig6C-F.hoc file. This will make the current clamp amplitude to be 0.
These graphs take hours to reproduce and should look like:
However, note that the color code for the figure 4F,in the paper, is
not the same as in the figure that NEURON generates. This is because
NEURON uses different sets of colors to specify different
traces. Traces in the paper were re colored for better visibility and
representation. Another difference is in the annotation of these
traces. Default annotation in NEURON uses compartment name and
location of the segment within that compartment to represent the
variable being recorded. In the paper this annotation was simplified
and compartments were categorized into soma, apical trunk (Trunk) and
oblique dendrites (Oblique) and their respective distances from
soma/branch points (in the case of obliques) was given. However the
order of the traces (in terms of annotation, from top to bottom) is
the same in the paper as well as in the figure generated by running
this program. Clicking of Fig6C-F.hoc will run the simulation for the
figures 6C-F in the paper. These correspond to the black traces in
each panel and represent the condition when both NMDAR and mGluR are
present as sources of calcium elevation in the postsynaptic
compartment. To run this simulation, please make the 'Clamp Amplitude'
to be 0 in the 'parameters' panel that comes up after running
Fig6C-F.hoc file. This will make the current clamp amplitude to be 0.
These graphs take hours to reproduce and should look like:
 20140709 longip3dif.hoc and ip3pulse.hoc were removed from the archive
as they were part of the initial model building process and are not
necessary for the 3-D reconstruction model of calcium waves.
20220523 Updated MOD files to contain valid C++ and be compatible with
the upcoming versions 8.2 and 9.0 of NEURON.
20140709 longip3dif.hoc and ip3pulse.hoc were removed from the archive
as they were part of the initial model building process and are not
necessary for the 3-D reconstruction model of calcium waves.
20220523 Updated MOD files to contain valid C++ and be compatible with
the upcoming versions 8.2 and 9.0 of NEURON.