The models for the paper
W. Teka, J. Tabak, T. Vo, M. Wechselberger, and R. Bertram (2011) The
Dynamics Underlying Pseudo-Plateau Bursting in a Pituitary Cell Model,
Journal of Mathematical Neuroscience, 1:12, doi:10.1186/2190-8567-1-12
are available at the authors web site:
http://www.math.fsu.edu/~bertram/software/pituitary/JMN_11
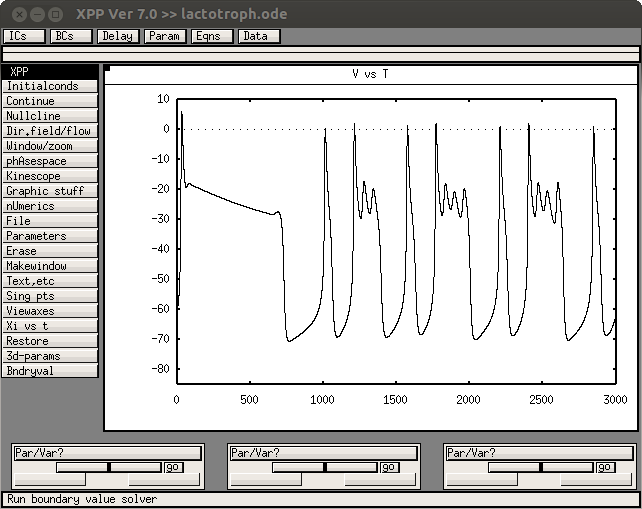
The 3-variable lactotroph model used in Figures 4, 9, 10, 12, and 13:
lactotroph.ode generates a figure like this:
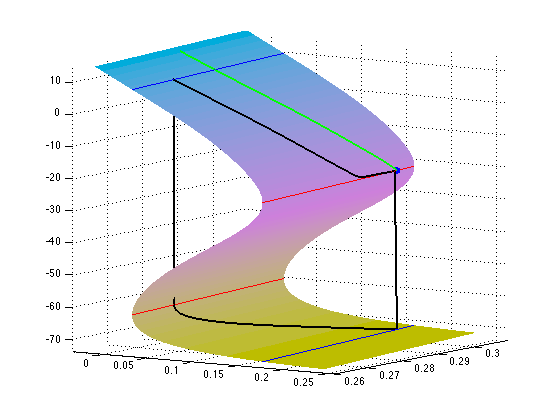
 and the Matlab code for the critical manifold and its 2-D projection
and various curves, used in Figures 2 and 3: manifold.m generates a
figure which when rotated looks like Figure 2:
and the Matlab code for the critical manifold and its 2-D projection
and various curves, used in Figures 2 and 3: manifold.m generates a
figure which when rotated looks like Figure 2:
 see the authors web site for these and more.