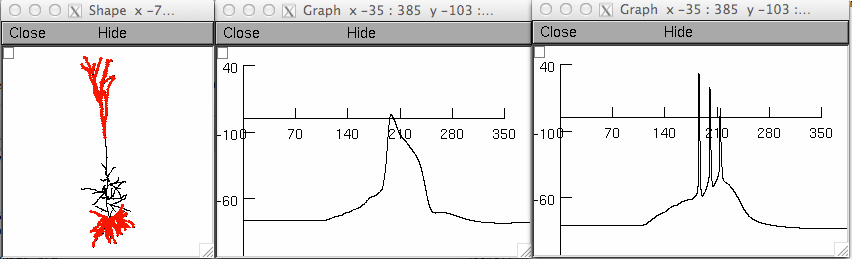
README FILE

This is the model associated with the paper:

Shai AS, Anastassiou CA, Larkum ME, Koch C (2015) Physiology of layer
5 pyramidal neurons in mouse primary visual cortex: coincidence
detection through bursting. PLoS Comput Biol 11:e1004090

Except for the data folder, this filesystem follows that of the Hay et
al., 2011 paper from which this work is based.

The compSig.m and compSig.py files are functions written in matlab and
python that take the number of tuft and basal synapses as input, and
output the action potential frequency, as given in the Composite
Sigmoid Model (Fig. 5).

In the data folder the dat files contain the raw somatic and dendritic
voltage traces for simulations containing distributed synapses (Fig. 3
and 4). Fig3.m is matlab code that plots those traces. Also in that
folder is PhenomModels.m which contains the composite, mulitplicative,
and additive models, and plots them.

In the simulationcode folder, Run.hoc is code which distributes
synapses along the basal and dendritic regions of the cell
(seperately) and controls how many inputs are in each. The temporal
distribution for the input is randomly chosen, as are their dendritic
locations (the distSynsUniform2.hoc file performs the placing of the
synapses).

The whole simulation for Fig.4 takes a few days to run, so a
simulation that runs one point in the parameter space with both
somatic and dendritic inputs is included, named Fig3A.hoc. This
simulation should take less than a minute to run and will generate
graphs that look similar to those in Fig. 3A and 3B in the paper::