This is the readme for a model associated with the paper
Polsky A, Mel B, Schiller J (2009) Encoding and decoding bursts by
NMDA spikes in basal dendrites of layer 5 pyramidal neurons.
J Neurosci 29:11891-903
These files were contributed by Dr. A. Polsky
glutamate.mod This is the simulated glutamate impact on the
postsynaptic cell via AMPA/NMDA receptors
Release parameters include
del: delay for the first pulse
Tspike: interspike (presynaptic release) intervals
Nspike: number of presynaptic pulses
gNMDAmax and gAMPAmax: postsynaptic conductances, in case of NMDA, the
peak possible conductance. In this simulation AMPA conductance was set
to zero.
decayAMPA, decayNMDA: degree of short term plasticity of the
postsynaptic conductances, in the paper it was set to one (meaning
same intensity for all pulses).
taudAMPA,taudNMDA: timecourse of the short term plasticity
layerV.hoc
the morphology and the basec biophysical properties of the cortical
layer 5 pyramidal cell (not the same cell as used in the original
paper)
main.hoc (+ses)
the file that runs the simulation
In the simulation, the glutamatergic synapse is located on a basal
branch (dend[73]). Paired pulse stimulation elicits an NMDA spike with
stimulation >10nS. NMDA spike threshold with a single pulse is
~18nS. Depolarizing the soma to recreate the expected first stimulus
depolarization shifts the single pulse threshold to ~15nS.
Below is a table of NMDA receptor conductance and somatic
depolarization with paired pulse stimulation, single pulse and single
pulse +somatic current injection of 0.15nA
2 0.2 0.1 0.1
4 0.4 0.2 0.2
6 0.6 0.3 0.3
8 0.9 0.2 0.5
10 1.3 0.5 0.7
12 2.2 0.7 1
14 4.1 0.8 1.3
16 5.1 1 1.8
18 5.86 1.3 2.6
20 6.5 1.7 3.3
22 7 2.6 3.8
24 7.5 3.7 4.2
26 7.8 4.4 4.6
28 8 5 4.9
30 8.2 5.4 5.2
32 8.4 5.8 5.5
34 8.5 6 5.7
36 8.6 6.1 5.8
Usage:
------
After autolaunching or downloading and compiling the mod files
(nrnivmodl (linux), mknrndll (ms win or mac os x), running the
simulation (with Init & Run button) will produce this default graph:
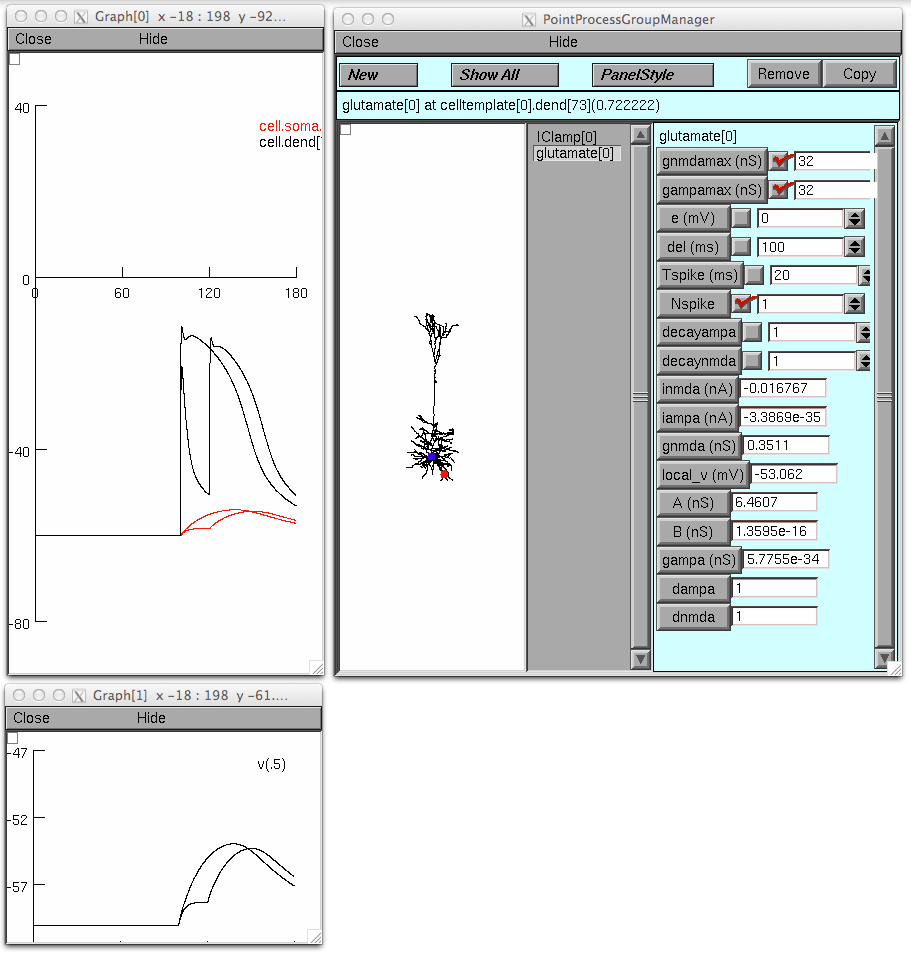
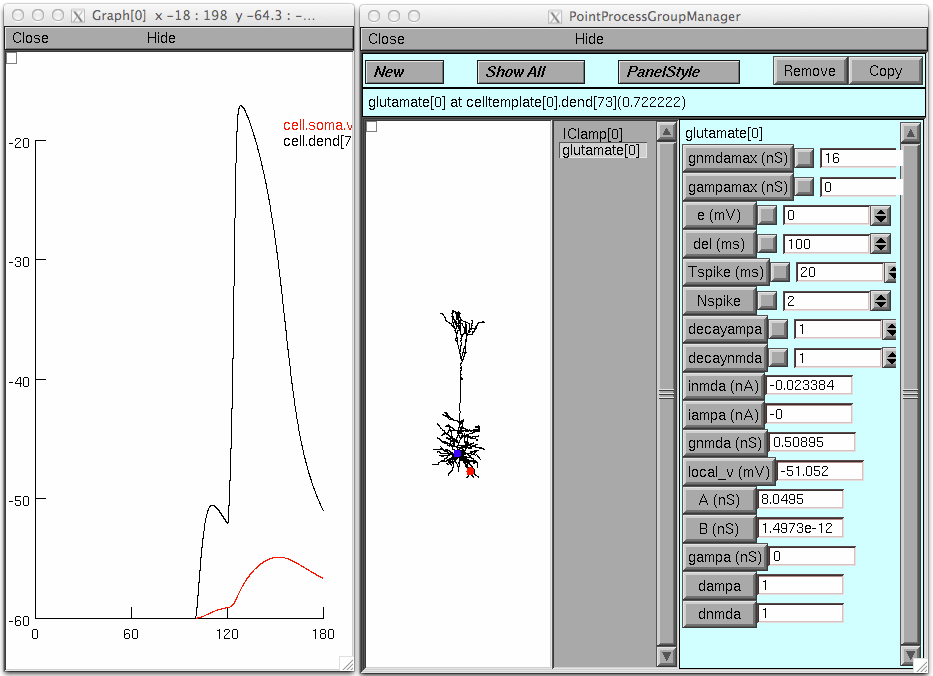 An illustration analagous to fig 9 in the paper: turn "Keep Lines" on
in the graph through the pop up menu, set the gnmdamax and gampamax to
16; run the simulation. Then set NSpike to 1 and set both conductance
densities to 32 and run the simulation; these graphs should appear:
An illustration analagous to fig 9 in the paper: turn "Keep Lines" on
in the graph through the pop up menu, set the gnmdamax and gampamax to
16; run the simulation. Then set NSpike to 1 and set both conductance
densities to 32 and run the simulation; these graphs should appear: