This is the README file for simulation codes associated with:
Hiratani N, Fukai T (2018) Redundancy in synaptic connections enables neurons to learn optimally. Proc Natl Acad Sci U S A
http://dx.doi.org/10.1073/pnas.1803274115
The codes were created based on the L2/3 cell model in Smith et al. (2013) (http://www.opensourcebrain.org/projects/l23dendriticspikes).
This code was contributed by N Hiratani and questions should be addressed to n.hiratani"at"gmail.com
"neuron_simulation.py" is the main simulation code from which Figure 3-5 in the manuscript were generated. To run the simulation, first type "nrnivmodl" for compiling the mod files, then run "neuron_simulation.py" as a standard python program. The program receives six parameters from the standard input as below:
[1]Kin: The number of synapses per connection. Here, the total number of presynaptic neurons is fixed at Min = 200, so that the total number of synaptic connections is given as Nin = Kin*Min.
[2]gmax: The standard excitatory conductance. The synaptic weight of the i-th synaptic contact was defined by gmax*uks[i].
[3]gI: The standard inhibitory conductance. All inhibitory weights were set to gI.
[4]uk_min: Minimum value of the spine size.
[5]sd_bias: Bias in synaptic distribution. If sd_bias < 1.0, then the synaptic distribution is biased towards the proximal side and vice versa.
[6]release_probability: Release probability of synaptic vesicle at excitatory synapses.
Then, the program generates (some of) following output files:
nrn_simul_vkappas_... : Te value of the unit EPSP at each dendritic section. nrn_simul_perf_... : EPSP heights and areas for test stimuli. nrn_simul_duvk_... : Values of synaptic weight uk and unit EPSP vk. nrn_simul_mbps/nrn_simul_mbpf : The somatic membrane dynamics before/after learning.
Example Run: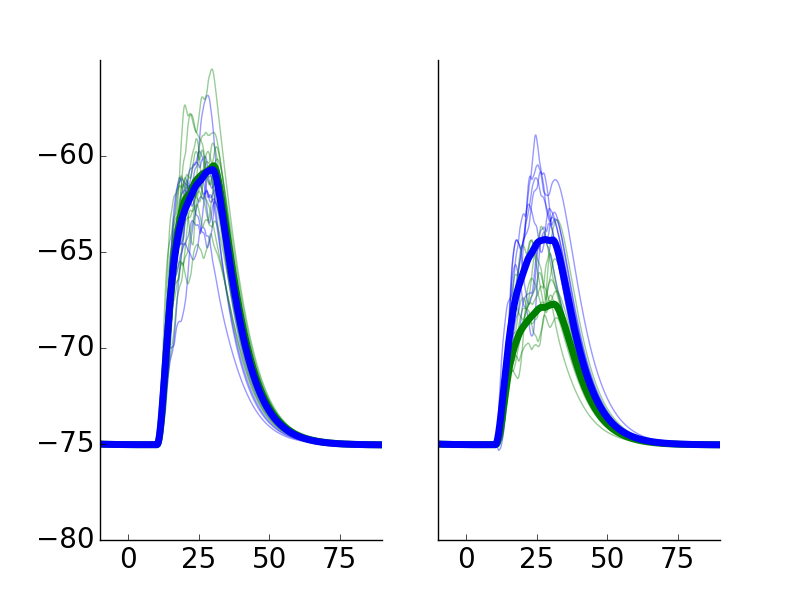 Codes used for generation of other panels are omitted from the model
file for brevity. All the additional details are specified in the
article and the supplementary information (SI). SI file is available
at
http://www.pnas.org/content/pnas/suppl/2018/06/30/1803274115.DCSupplemental/pnas.1803274115.sapp.pdf
Additionally, all simulation codes are available upon reasonable
request to n.hiratani"at"gmail.com.
Codes used for generation of other panels are omitted from the model
file for brevity. All the additional details are specified in the
article and the supplementary information (SI). SI file is available
at
http://www.pnas.org/content/pnas/suppl/2018/06/30/1803274115.DCSupplemental/pnas.1803274115.sapp.pdf
Additionally, all simulation codes are available upon reasonable
request to n.hiratani"at"gmail.com.