%%
%% Readme me file for Statistical long-term synaptic plasticity (statLTSP) code
%%
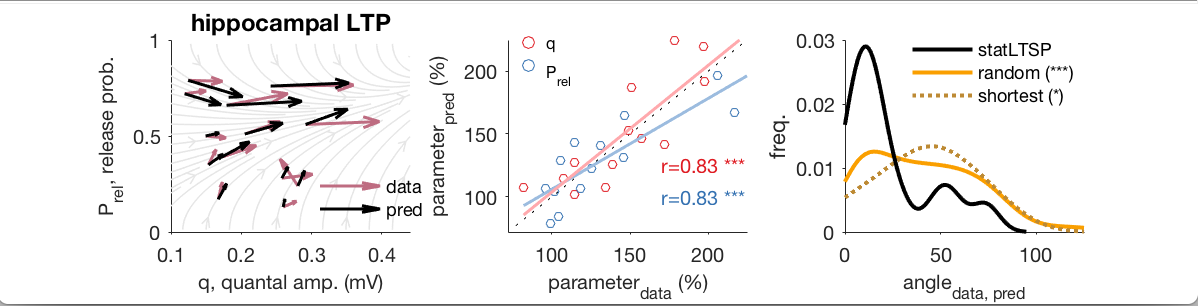
%% Reference: Costa et al. Neuron, Volume 96, Issue 1, 27 Sept 2017, Pages 177-189
%%
Requirements: This code was tested in Matlab2016b on Mac OS X (but should run on other version)
Data: All datasets are available on Mendeley Data (see paper for more details)
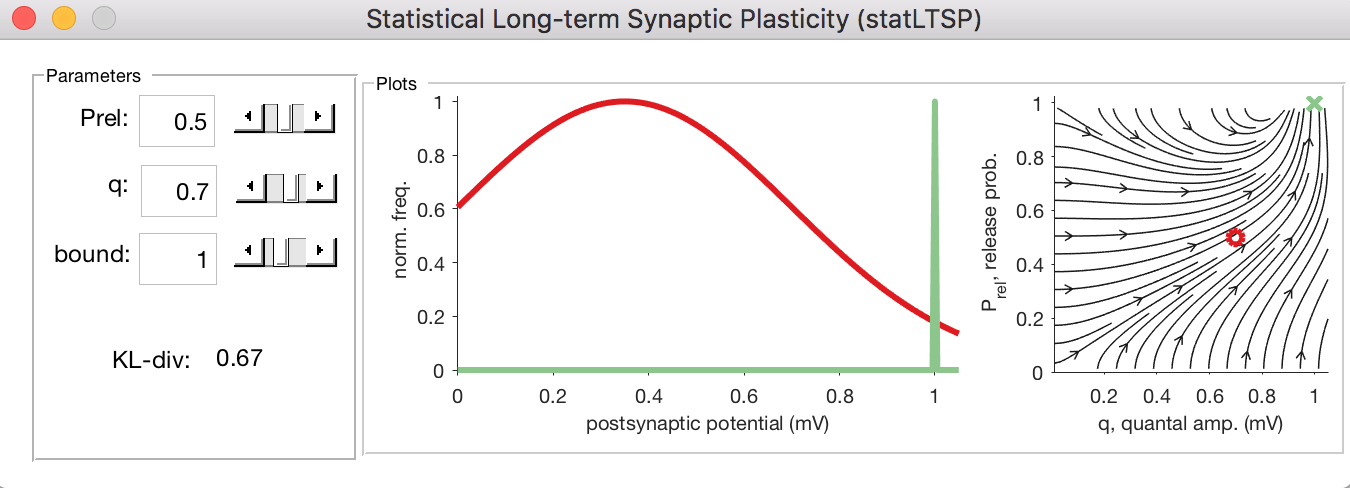
Important note: In our framework we always work with q normalised (unitless). This is because when comparing with the data we scale q by the mean q in the data (see Methods). However, for the plots we map q back to mV to be easily comparable with observed values. In addition we assume an Euclidean metric (in contrast to a Riemannian metric for example) for the gradient descent, because this was sufficient to match experimental observations.
Note 2: You should be able to easily get the code you need and translate it to other programming languages.
20180612 Rui Costa updated this archive to add clarifications to the code and readme.