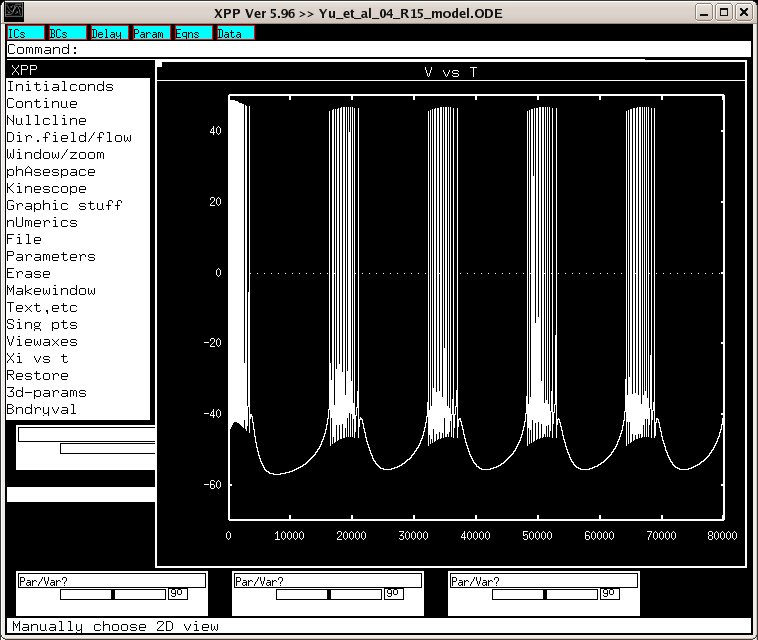
This is the readme for the model associated with the publication:

Yu X, Byrne JH, Baxter DA (2004) Modeling interactions between
electrical activity and second-messenger cascades in Aplysia neuron
R15. J Neurophysiol 91:2297-311

The biophysical properties of neuron R15 in Aplysia endow it with the
ability to express multiple modes of oscillatory electrical activity,
such as beating and bursting. Previous modeling studies examined the
ways in which membrane conductances contribute to the electrical
activity of R15 and the ways in which extrinsic modulatory inputs
alter the membrane conductances by biochemical cascades and influence
the electrical activity. The goals of the present study were to
examine the ways in which electrical activity influences the
biochemical cascades and what dynamical properties emerge from the
ongoing interactions between electrical activity and these
cascades. The model proposed by Butera et al. in 1995 was extended to
include equations for the binding of Ca(2+) to calmodulin (CaM) and
the actions of Ca(2+)/CaM on both adenylyl cyclase and
phosphodiesterase. Simulations indicated that levels of cAMP
oscillated during bursting and that these oscillations were
approximately antiphasic to the oscillations of Ca(2+). In the
presence of cAMP oscillations, brief perturbations could switch the
electrical activity between bursting and beating
(bistability). Compared with a constant-cAMP model, oscillations of
cAMP substantially expanded the range of bistability. Moreover, the
integrated electrical/biochemical model simulated some early
experimental results such as activity-dependent inactivation of the
anomalous rectifier. The results of the present study suggest that the
endogenous activity of R15 depends, in part, on interactions between
electrical activity and biochemical cascades.

Usage:
To run in default setting start the model under linux with:

xppaut Yu_et_al_04_R15_model.ODE

Select Initialconds->Go
Wait a bit for the 80000 ms simulation to complete.
Select Window/zoom -> Window and fill in
X Lo:0, X Hi:80000
Y Lo:-70, Y Hi:50

You should then see this graph: